Let’s start with a question so familiar that you will have answered it before the sentence is even completed:
How many studies will a researcher need to run before finding a significant (p<.05) result? (If she is studying a non-existent effect and if she is not p-hacking.)
Depending on your sophistication, wariness about being asked a potentially trick question, or assumption that I am going to be writing about p-hacking, there might be some nuance to your answer, but my guess is that for most people the answer comes to mind with the clarity and precision of certainty. The researcher needs to run 20 studies. Right?
That was my answer. Or at least it used to be [1] I was relying on a simple intuitive representation of the situation, something embarrassingly close to, “.05 is 1/20. Therefore, you need 20. Easy.” My intuition can be dumb.
For this next part to work well, I am going to recommend that you answer each of the following questions before moving on.
Imagine a bunch of researchers each studying a truly non-existent effect. Each person keeps running studies until one study succeeds (p<.05), file-drawering all the failures along the way. Now:
What is the average number of studies each researcher runs?
What is the median number of studies each researcher runs?
What is the modal number of studies each researcher runs?
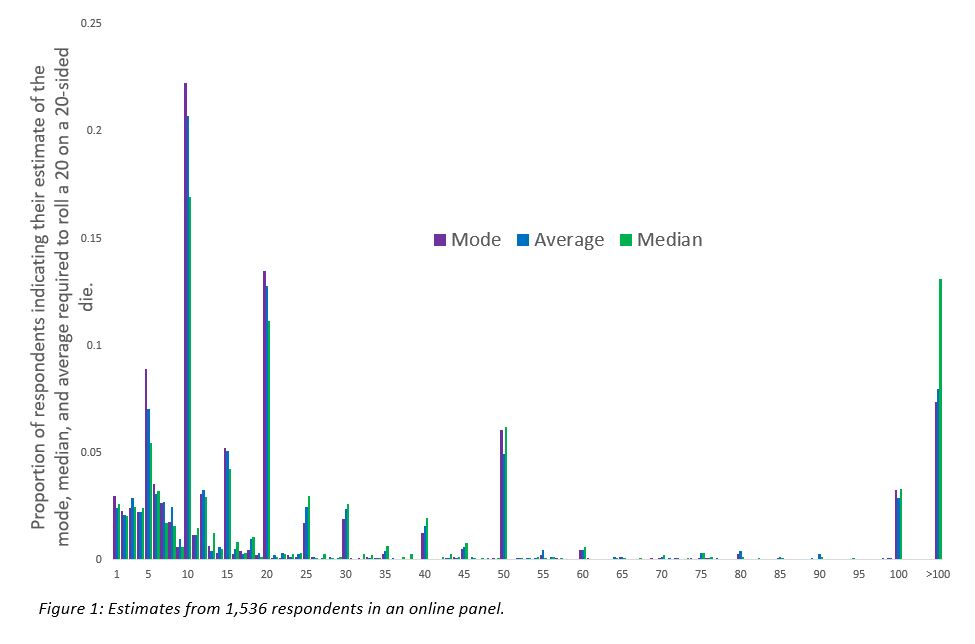
Before I get to the correct answers to those questions, it is worth telling you a little about how other people answer them. It is difficult to get a full sense of expert perceptions, but it is relatively easy to get a sense of novice perceptions. With assistance from my outstanding lab manager, Chengyao Sun, I asked some people (N = 1536) to answer the same questions that I posed above. Actually, so as to make the questions slightly less unfamiliar, I asked them to consider a closely related (and mathematically identical) scenario. Respondents considered a group of people, each rolling a 20-sided die and rolling it until they rolled a 20; respondents estimated the mode, median, and mean [2]. How did those people answer?
 I encourage you to go through that at your leisure, but I will draw attention to a few observations. People frequently give the same answer for all three questions [3], though there are slight overall differences: The median estimate for the mode was 11, the median for the average was 12, and the median for the median was 16. The most common response for all three was 10 and the second most common was 20. Five, 50, and 100 were also common answers. So there is some variability in perception, and certainly not everyone answers 20 for any or all questions, but that answer is common, and 10, a close conceptual cousin, was slightly more common. My guess is that you look at the chart and see that your answers were given by at least a few dozen others in my sample.
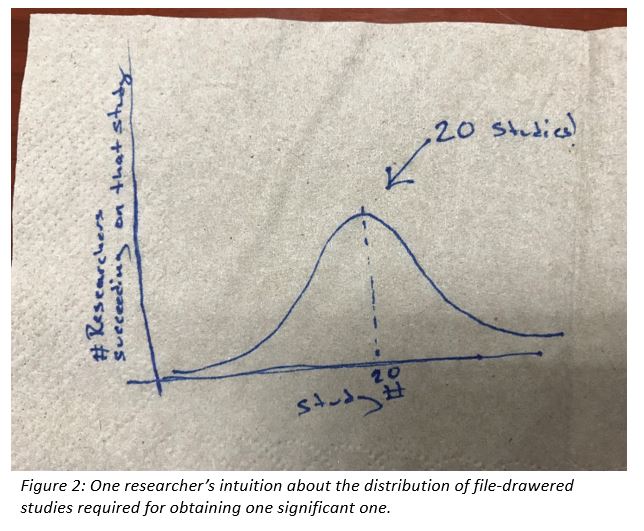
OK, so now that you have used your intuition to offer your best guess and you have seen some other people’s guesses, you might be curious about the correct answer for each. I asked myself (and answered) each question only to realize how crummy my intuition really was. The thing is, my original intuition (“20 studies!”) came polluted with an intuition about the distribution of outcomes as well. I think that I pictured a normal curve with 20 in the middle (see Figure 2).
Maybe you have a bit of that too? So that intuition tells us that 20 is the mode, 20 is the median, and 20 is the mean. Only one of those is right, and in most ways, it is the worst at summarizing the distribution.
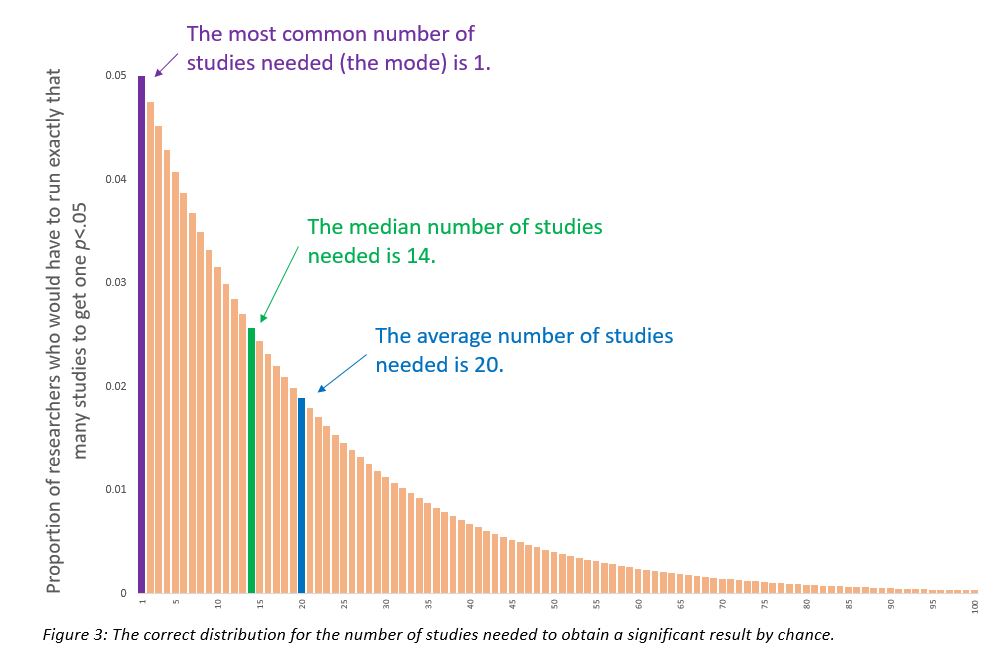
The distribution is not normal, it is "geometric" [4]. I may have encountered that term in college, but I tried to learn about it for this post. The geometric distribution captures the critical sequential nature of this problem. Some researchers get lucky on the first try (5%). Of those who fail (95%), some succeed on the second try (5% of 95% = 4.75%). Of those who fail twice (90.25%), some succeed on the third try (5% of 90.25% = 4.5%). And so on.
Remember that hypothetical group of researchers running and file-drawering studies? Here is the expected distribution of the number of required studies.
 That is really different from the napkin drawing. It takes 20 studies, on average, to get p<.05… but, the average is a pretty mediocre way to characterize the central tendency of this distribution [5].
Let’s return to that initial question: Assuming that a researcher is studying a truly false finding, how many studies will that person need to run in order to find a significant (p<.05) result? Well, one could certainly say, “20 studies,” but they could choose to clarify, “… but most of the time they will need fewer. The most common outcome is that the researcher will succeed on the very first try. I dare you to try telling those people that they benefitted from file-drawering.”
It is interesting that we think in terms of the average here, since we do not in a similar domain. Consider this question: “A researcher is running a study. How many participants do they need to run to get a significant effect?” To answer that, someone would need to know how much statistical power the researcher was aiming for [6]. For whatever reason, when we talk about the file-drawering researcher we don’t ask, “How many studies would that person need to be ready to run to have an 80% chance of getting a significant result?” That answer, by the way, is 32. If the researcher listened to my initial answer, and only planned to run 20 studies, they would only have 64% power.
For whatever reason, people [7] do not intuit the negative binomial. In my sample, estimates for the median were higher than for the mean, a strong signal that people are not picturing the sharply skewed true distribution. The correct answer for the average (20), on the other hand, was quite frequently identified (I even identified it), but probably not because overall intuition was any good. The mode (1) is, in some ways, the ONLY question that is easy to answer if you are accurately bringing to mind the distribution in the last figure, but that answer was only identified by 3% of respondents, and was the 10th most common answer, losing out to peculiar answers like 12 or 6.
I think there are a few things that one could take from this. I was surprised to see how little I understood about the number of studies (or ineffective die rolls) file drawered away before a significant finding occurred by chance. I was partially comforted to learn that my lack of understanding was mirrored in the judgments of others. But I am also intrigued by the combination. A researcher who intuits the figure I drew on the napkin will feel like a study that succeeds in the first few tries is too surprising an outcome to be due to chance. If the true distribution came to mind, on the other hand, a quickly significant study would feel entirely consistent with chance, and that researcher would likely feel like a replication was in order. After all, how many studies will a researcher need to run before finding two consecutive significant (p<.05) results?
![]()
Footnotes.
- Honestly, I would still be tempted to give that answer. But instead I would force the person asking the question to listen to me go on for another 10 minutes about the content of this post. All that person wanted was the answer to the damn question and now they are stuck listening to a short lecture on the negative binomial distribution and measures of central tendency. Then again, you didn’t even ask the question and you are being subjected to the same content. Sorry? [↩]
- Actually, half the people imagined people trying to roll a 1. There are some differences between the responses of those groups, but they are small and beyond my comprehension. So I am just combining them here. [↩]
- I also asked a question about 80% power, but I am ignoring that for now. [↩]
- When I first posted this blog I referred to it as the negative binomial, but actually that's about how many successes you expect rather than how long until you get the first success. Moreover, the geometric is about how many failures until the 1st success, what we really want is how many attempts, which is the geometric +1. My quite sincere thanks to Noah Silbert for pointing out the error in the original posting. [↩]
- Actually, it is not even the average in that figure. I truncated the distribution at 100 studies, and the average in that range is only 19. One in 200 researchers would still have failed to find a significant effect even after running 100 studies. That person would be disappointed they didn’t just try a registered report. [↩]
- They would actually need to know a heck of a lot more than that, but I’m keeping it simple here. [↩]
- well, at least me and the 1,536 people I asked. [↩]

