Before we got distracted by things like being sued, we had been working on a series called Meaningless Means, which exposed the fact that meta-analytic averaging is (really) bad. When a meta-analysis says something like, “The average effect of mindsets on academic performance is d = .32”, you should not take it at face value. You should take it as evidence that there are numbers.
Such averages are rendered meaningless by a spate of problems, of which we’ve focused on two:
1. Meta-analyses almost always include bad studies – those that are poorly designed, confounded, bad tests of the meta-analytic hypothesis, plagued by errors, etc. – and averaging bad studies together with good (or bad) studies will produce a bad average.
2. Meta-analyses almost always include studies that are very different from each other, that test different specific hypotheses. Averaging across such different studies gives you a meaningless mean. For example (from Colada [105]), one study might examine whether people eat more when you give them more to eat, whereas another might test whether reminding people to go to sleep on time makes them sleep longer. Although at a very abstract level both studies might be testing a broadly similar hypothesis [1], at the concrete level of what-was-actually-studied they test two very different hypotheses. Averaging across these studies makes no sense, for that average is not meaningful. You may as well average your height with the word count of your dissertation and send the result to a top-tier journal (“A Meta-analysis of Me”).
For more about this, check out our introduction to this series (Colada [104]), as well as our subsequent posts. Here my purpose is to discuss another example, one that provides a stark illustration of the problem of averaging across different kinds of studies [2].

Do People Correct For Scientific Misinformation?
Imagine someone is on a diet. They wanted to lose 10 pounds but they “only” lost 5. You could consider what the diet accomplished and call it +5 pounds of weight loss. You could consider what the diet didn’t accomplish and call it -5 pounds of failed weight loss.
But what you’d never ever do is average what the diet accomplished (+5 pounds of weight loss) with what the diet didn’t accomplish (-5 pounds of weight loss), and then conclude the diet had no effect. That wouldn't make much sense…
***
In June 2023, Nature Human Behaviour published, “A meta-analysis of correction effects in science-relevant misinformation” (.htm). The paper’s abstract presents a dire conclusion [3]:
“attempts to debunk science-relevant misinformation were, on average, not successful (d = 0.11, p = .142).”
I’m here to tell you that maybe things are not so dire.
To obtain that result, the meta-analysis did what almost all meta-analyses do: they averaged effects from very different studies [4]. In this case, the meta-analysis averaged together what an intervention accomplished with what it didn't accomplish.
When you present people with misinformation and then tell them that it’s wrong, you can measure two different outcomes:
- How much people correct their beliefs (coded positively)
- How much their misinformed beliefs persist (coded negatively)
For example, imagine you presented people with some (fake) evidence that eating ants cures COVID, and then assessed how much they believed that. Your study could look like this:
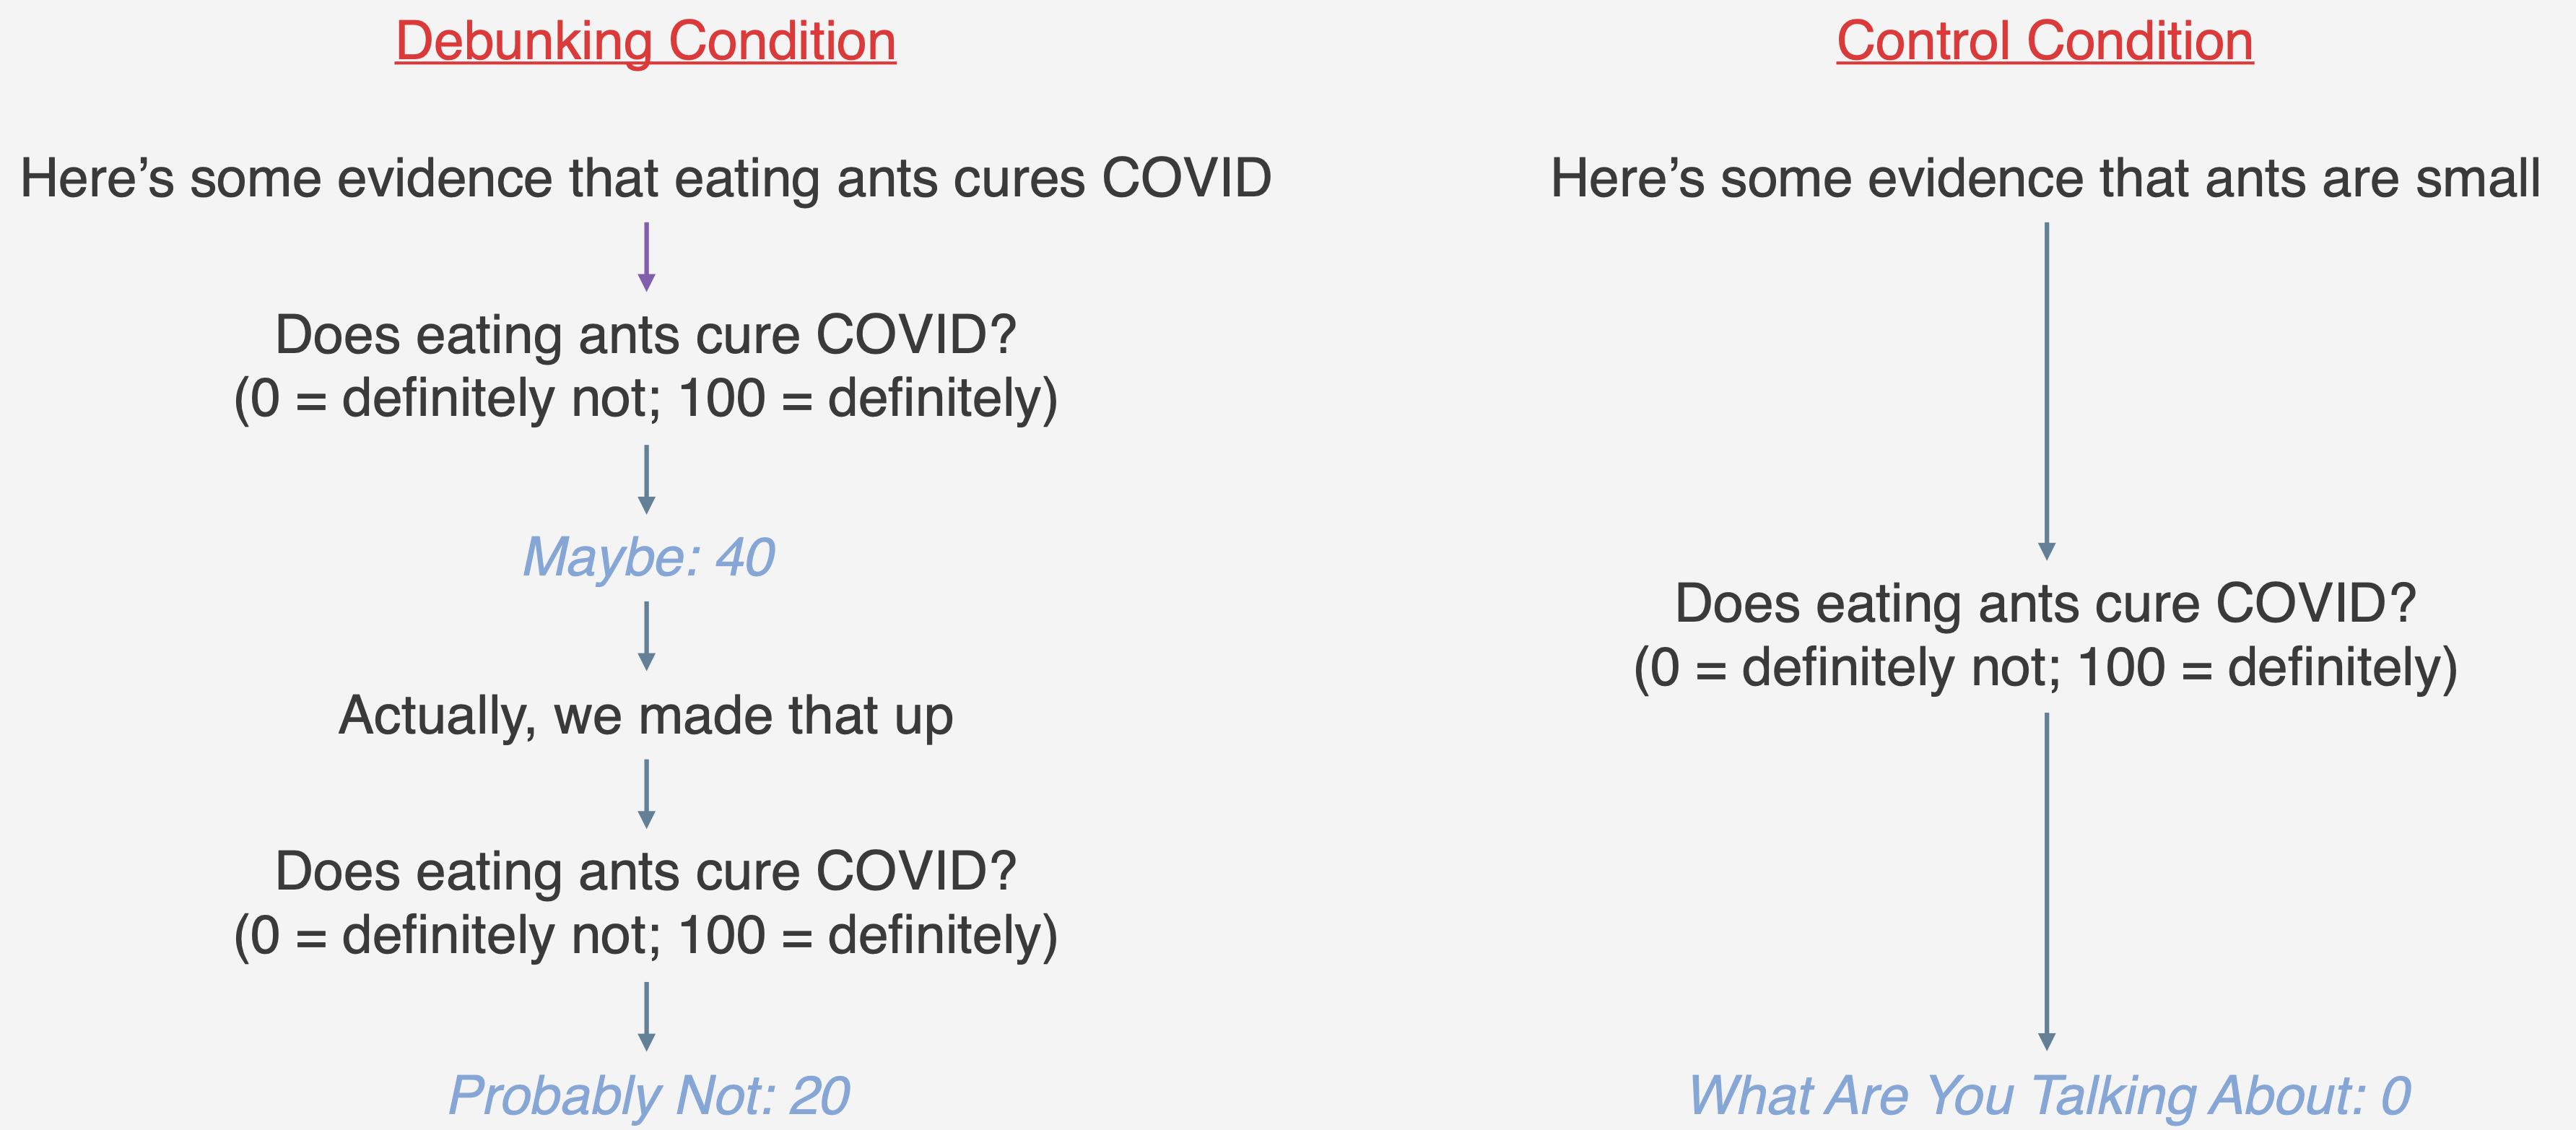
This study design gives you a chance to estimate both the correction effect and the persistence effect:
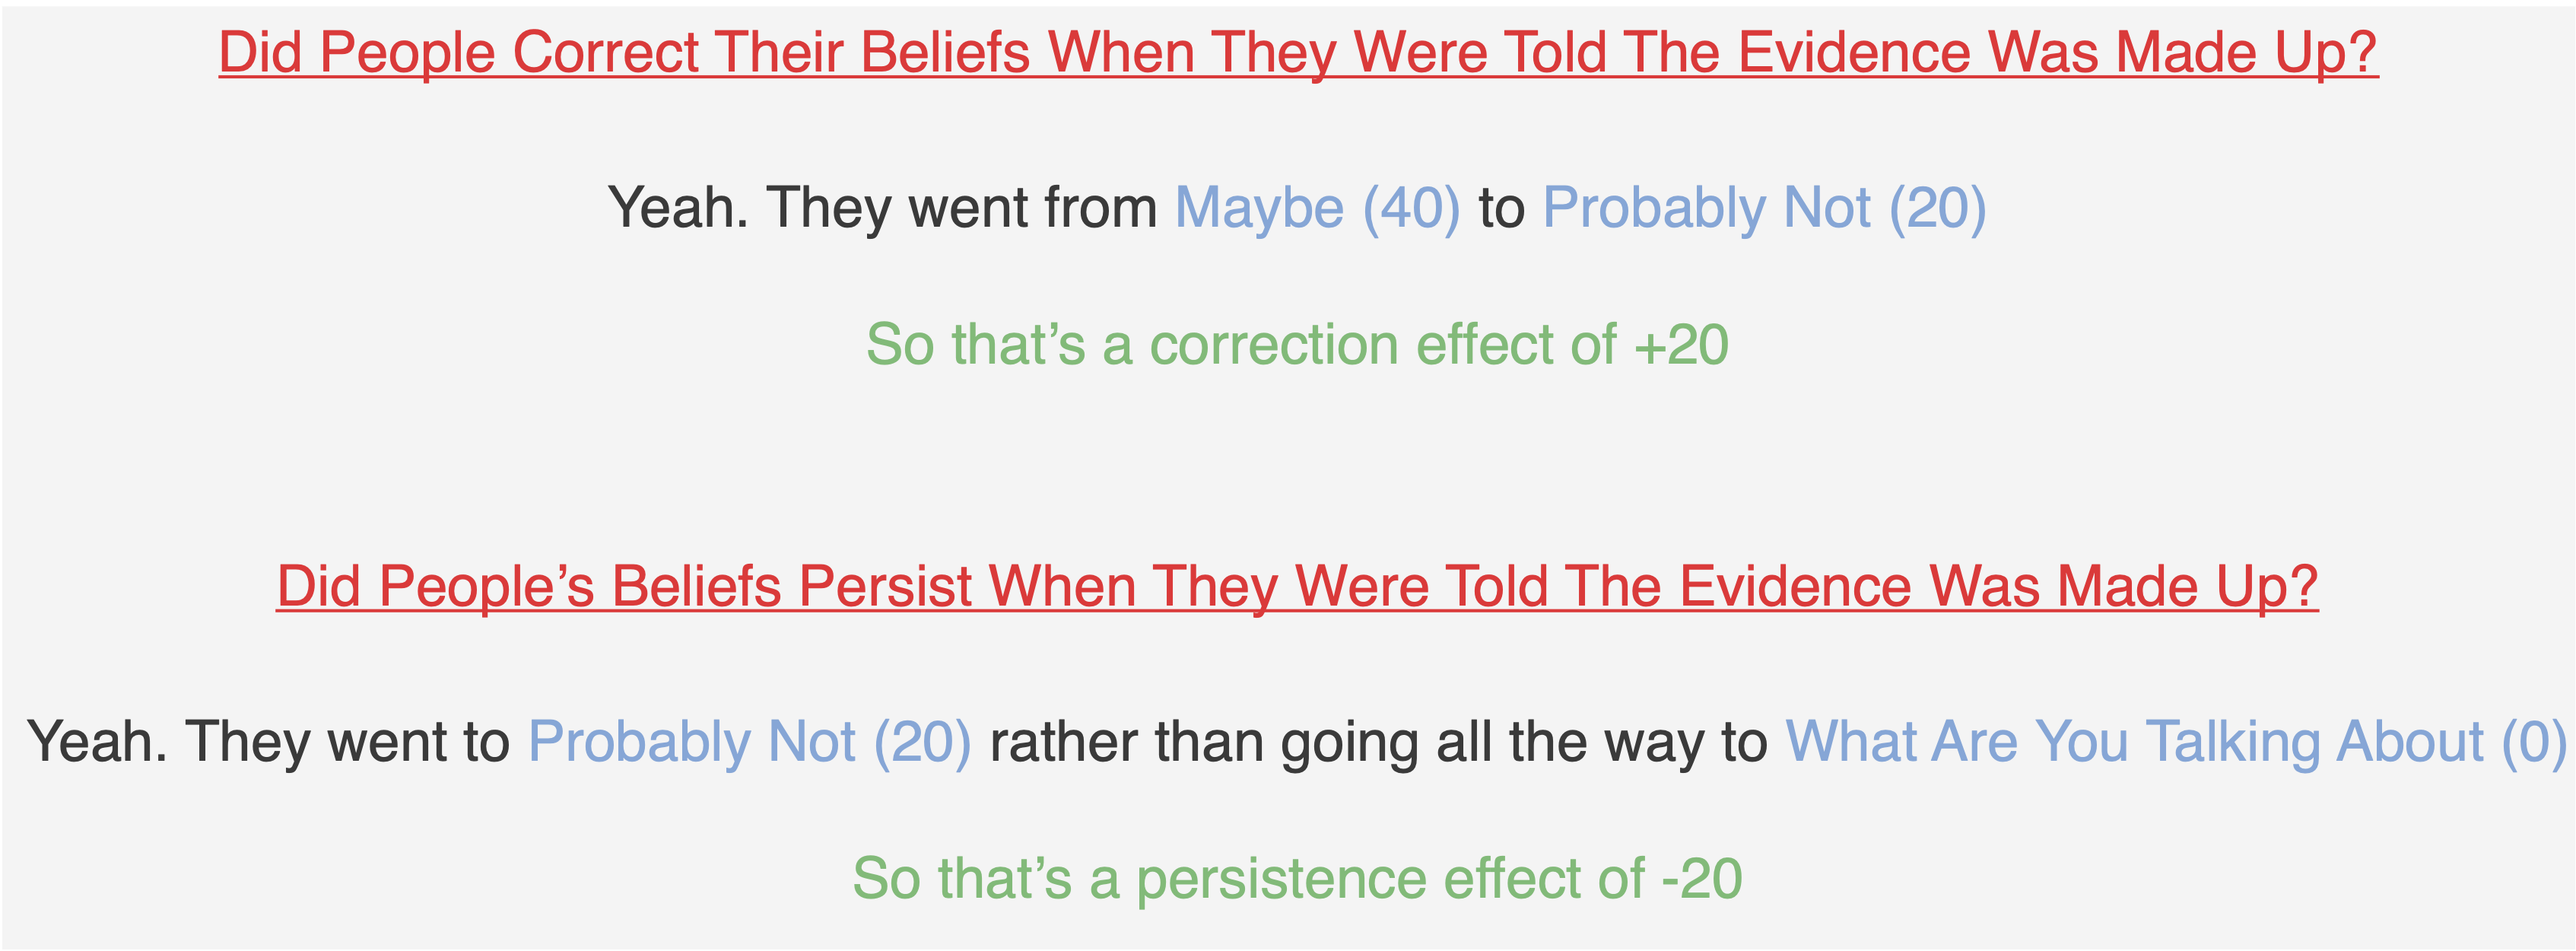
The meta-analysis includes both the correction effects and the persistence effects and then averages them [5]. So in this hypothetical you’d average +20 and -20 and get zero. And so it would look like people do not correct their beliefs at all. I think this is wrong, as people did correct, just not all the way.
The authors helpfully posted their data and code (.htm), allowing us to separately analyze the effect sizes for these two different outcomes: belief correction and belief persistence [6]:
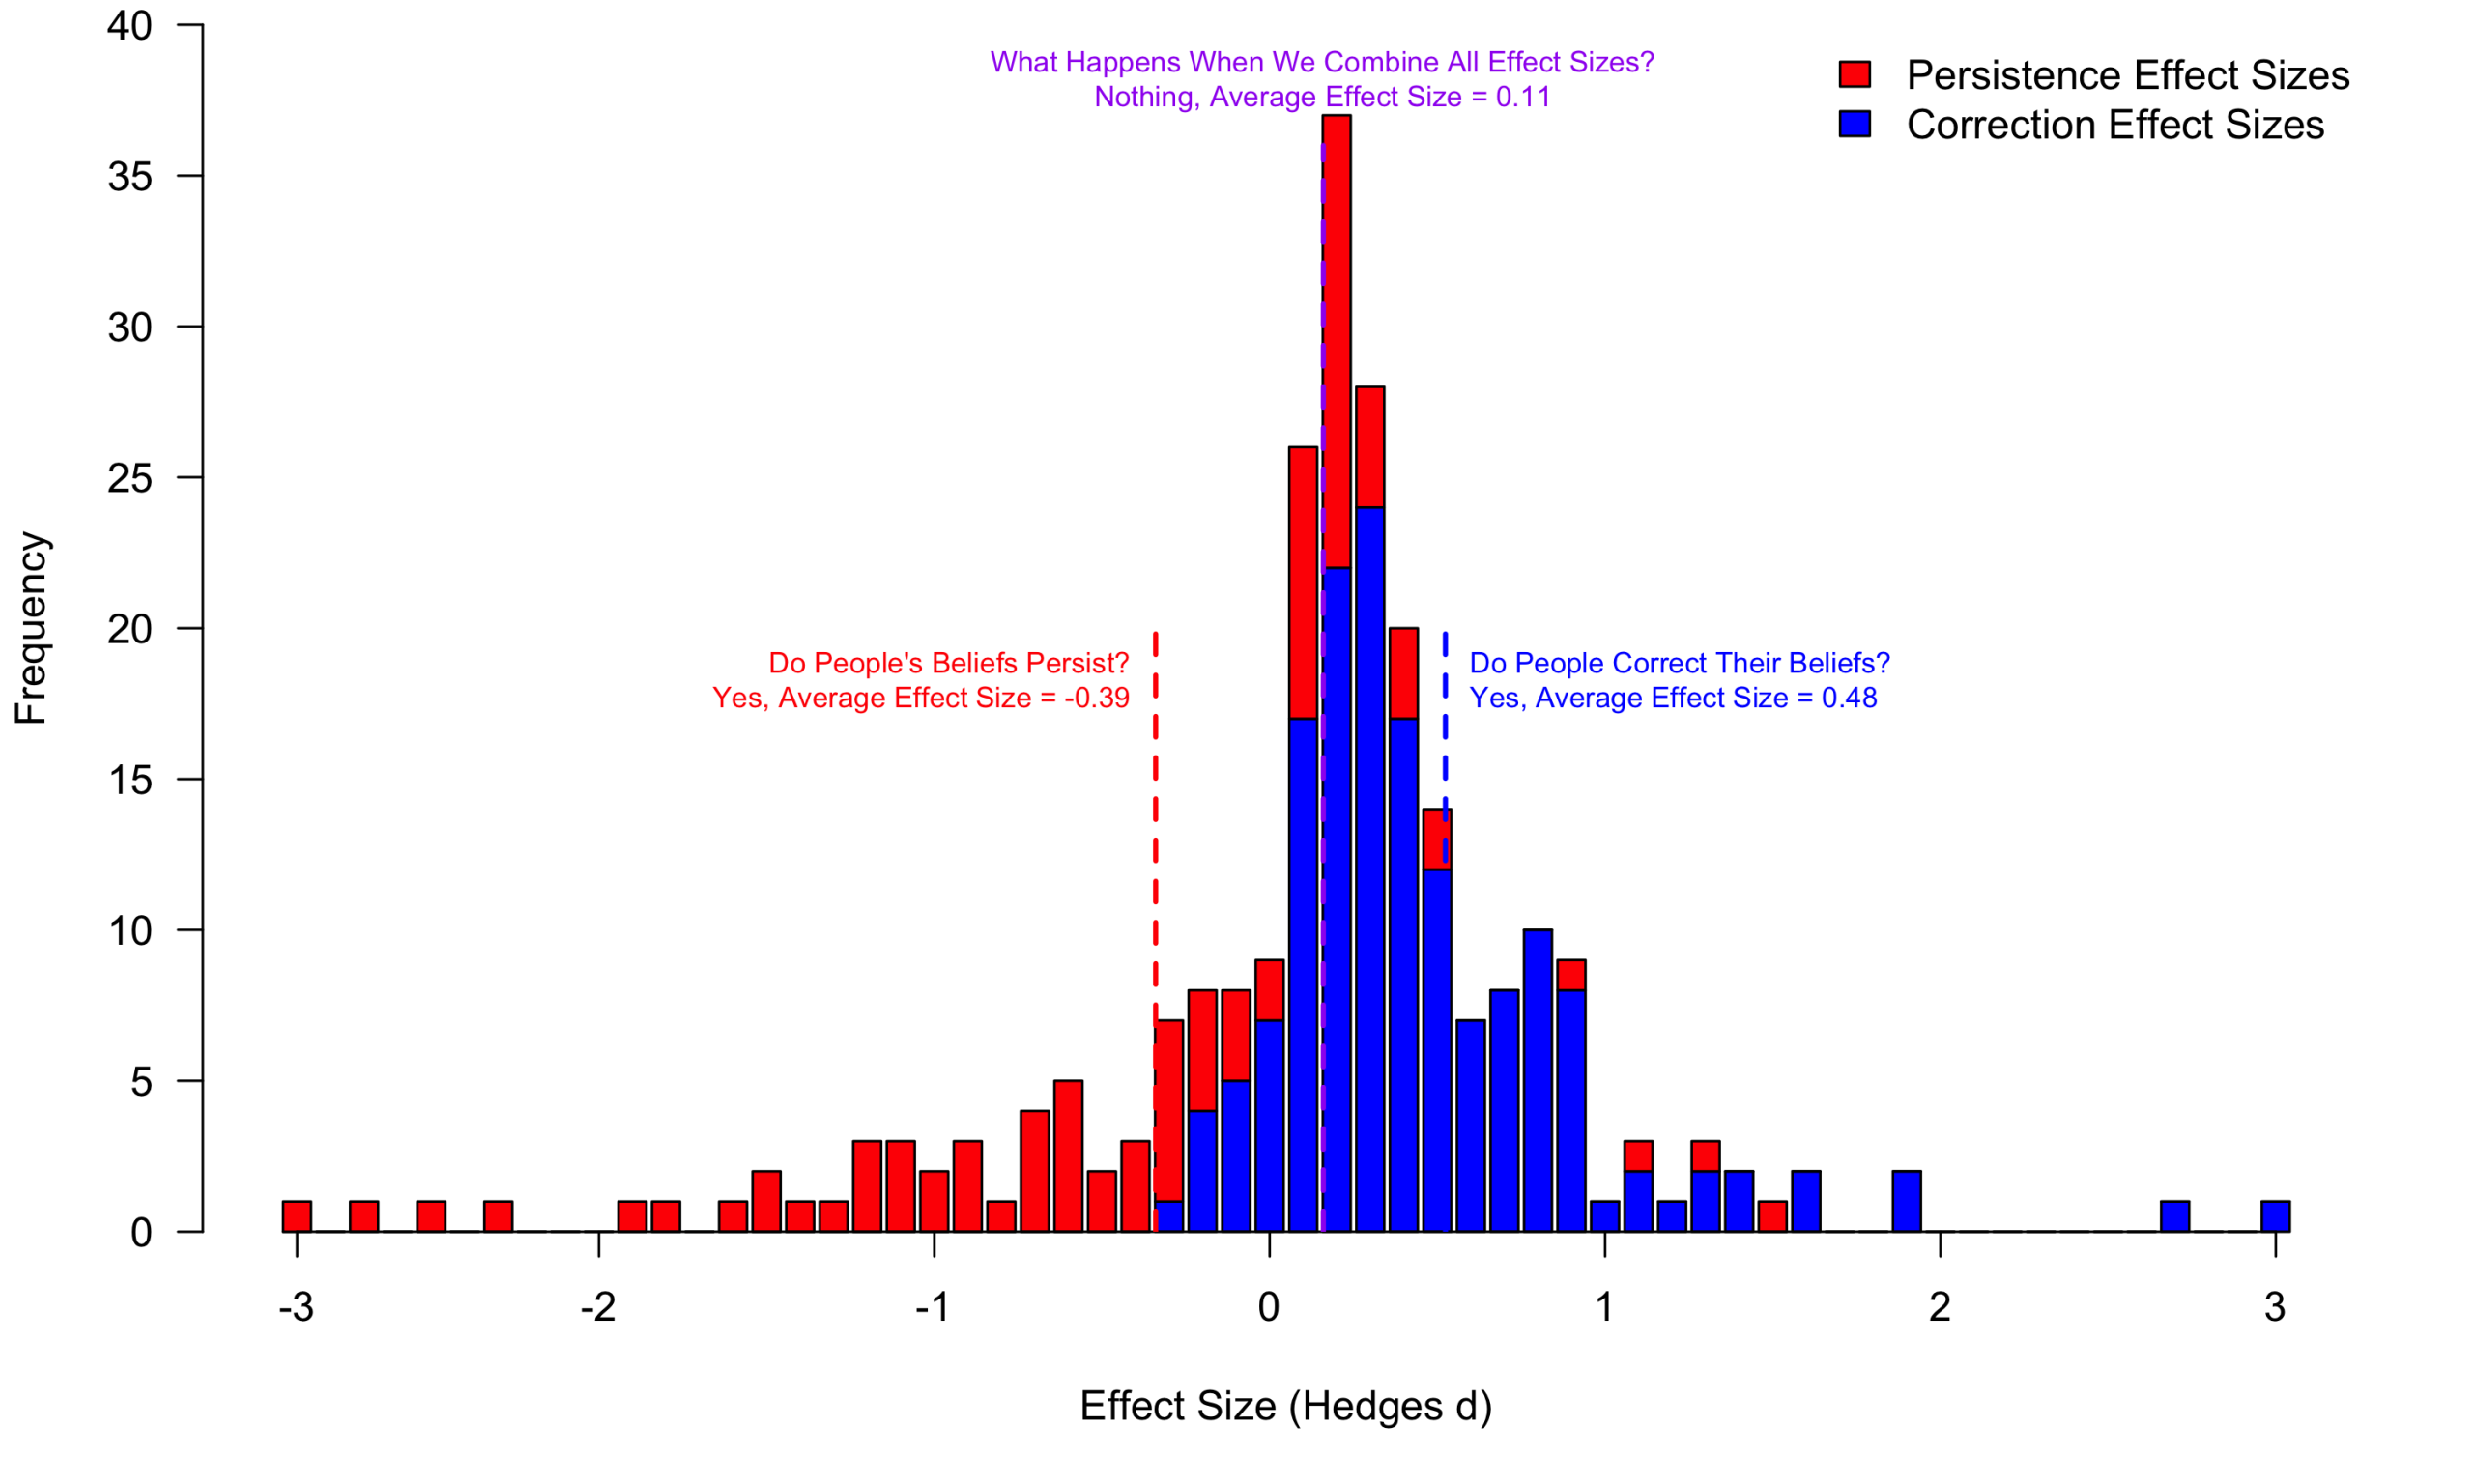
As you can see in this stacked histogram, both effects are well supported [7].
- People DO significantly correct their beliefs: d = .48, t(54) = 8.42, p < 10-11
- But beliefs do persist: d = -.39, t(40) = -3.40, p = .0015
You can also see that averaging across them yields virtually nothing, just a small and non-significant effect. The effect happens to lean positive (d = .11) largely because the dataset contains more of the mostly-positive "correction" effect sizes than the mostly-negative "persistence" effect sizes [8].
I should emphasize that you should not go around citing any of these numbers, both because even averaging within these categories does not make sense since the studies are very different, and because some of the effect sizes may be invalid. Carefully read the individual studies and draw conclusions based on what you read.
All told, this example highlights, in a particularly stark way, one of the big problems with meta-analysis: Averaging together different things can lead to the wrong conclusion. The Nature Human Behaviour paper tells us that attempts to debunk scientific information are not successful. Fortunately for those of us in the debunking business, that conclusion may not be right.
![]()
Author feedback
I shared an earlier draft of this post with the authors of the meta-analysis, and invited them to write a response. They provided prompt, cordial, and constructive feedback, and you can read their response here: (.pdf).
Footnotes.
- A published meta-analysis codes them as both testing the effects of nudges on behavior. [↩]
- The data and code for this post can be found on ResearchBox: https://researchbox.org/4341. [↩]
- The original article was published in 2023, but the authors found some mistakes in the coding of their effect sizes, and the article is in the process of being corrected. The article's major conclusions have not been altered by these corrections. The numbers and analyses presented in this post use the *corrected* article and updated data. [↩]
- To be fair, the meta-analysis does not primarily focus on this one overall average, but rather on investigating moderators. The authors explore heterogeneity in effect sizes, and they also correlate effect sizes with various features of the studies underlying them, an inherently correlational endeavor. They also separately report the average "correction" effect size that I refer to below, though it was not referred to as such in the original published paper. In this post I am focused on what appears in the paper's abstract, the overall "debunking" effect, as that is what most readers will see and is also the strongest basis for the authors' pessimistic conclusions. [↩]
- Meta-analysts frequently use techniques that compute weighted or adjusted averages – sometimes weighting by the number of studies or participants and adjusting for covariates – rather than simple averages. But they are averages. Indeed, the simple average of all of the effects in this meta-analysis is d = .1138, which is nearly identical to the d = .1099 that you get when you use the meta-analysts' technique. [↩]
- For the purposes of the graph, effect sizes greater than 3 and less than -3 were winsorized to 3 and -3, respectively. The average effect sizes reported in the graph (and below) use the non-winsorized data and are outputs from a correlated-effects meta-analysis. [↩]
- The results below come from "correlated effects" models, the same model that the authors used to compute their overall effect of d = .11. In the new version of the manuscript, the authors do separately report a correction effect, but they report d = .39 (t(54) = 7.07) instead of my d = .48. This is because they use a "hierarchical effects" model that assumes that the effect sizes are independent from each other. I prefer the correlated effects model since multiple effects can come from the same study, but it doesn't really matter, as the overall message is the same. It may also be worth noting that the simple averages of the below effects are d = .41 and d = -.42. [↩]
- If the two types of effect sizes had been represented in equal numbers, then the average effect would have been even closer to zero: (.48-.39)/2 = .055. [↩]