A previous version of this post was supposed to go live in January 2019. But the day before it was scheduled, the Data Colada team (Uri, Leif, and Joe) received an email that we took to be a potential death threat. After discussions with the local police, the FBI, and our families, we decided to postpone its publication indefinitely.
That post provided evidence of data fabrication in a paper authored by Ping Dong, a former professor at the Kellogg School of Management at Northwestern University. We recently learned that Ping Dong’s PhD institution – the University of Toronto – has concluded an investigation into her work that has led them to revoke her PhD after they "found it likely she fabricated data in her thesis" (source: RetractionWatch story).
![]() It is important to emphasize that we do not know who authored the threatening email, and that we were unaware of Toronto's investigation until we read about it on RetractionWatch.
It is important to emphasize that we do not know who authored the threatening email, and that we were unaware of Toronto's investigation until we read about it on RetractionWatch.
The original paper
The paper was published by Ping Dong and Chen-Bo Zhong in Psychological Science in 2017 (.pdf). It was retracted in 2018. The paper purports to show that people perceive a lower risk of transmission of contagious diseases while in darker rooms.
Before getting to the meat of this post, I want to mention that Chen-Bo Zhong was not involved in data-collection or analysis and seemed truly interested in understanding what had happened from the very beginning.
The retraction
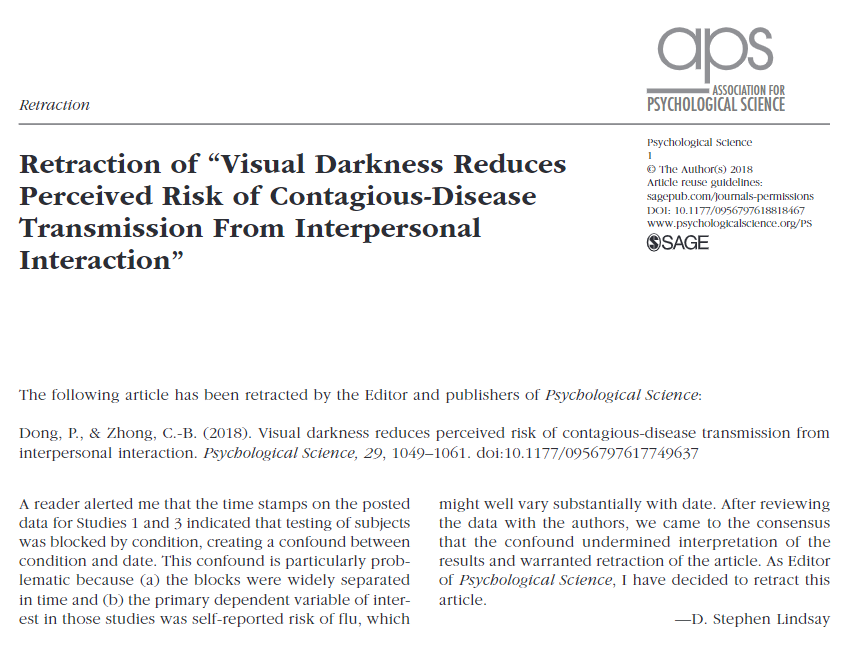
The paper was retracted after an anonymous reader, whom I will call Alex, alerted the then-editor of Psych Science of several data anomalies. The editor discussed these with the authors, and together they agreed to retract the article. The retraction (.html), however, only mentioned one of the anomalies Alex had identified: lack of random assignment. That anomaly was, in my view, the more benign-sounding one; so the retraction did not mention other anomalies that were, in my mind, more troubling.
For instance, Alex had noted that in one study, observations had been dropped in a way that dramatically favored the predicted effect (dropping extremely high values in one condition, and extremely low values in the other). The alleged -but implausible- rationale for these exclusions was that those participants had the flu. In another study involving three waves of data collection, the effect was nonexistent for the first two waves, and gigantic for the third wave.
I told Alex I would be happy to write a blogpost sharing the anomalies that the retraction had left out, and Alex agreed. First, though, we would do additional analyses together. I asked the authors to provide “collaborator access” to the Qualtrics survey of the study with three waves of data collection, so that we could check what the raw data looked like. The authors promptly granted such access.
Alex and I were expecting this raw Qualtrics data not to match the data that had been posted to (and subsequently deleted from) the OSF. But, to our surprise, the raw and posted data matched perfectly.
In all of my experiences with data fraud, I had never encountered this scenario, where extremely suspicious data perfectly matched the originally collected data. And so this investigation required tools that were different from that of previous cases.
That the data matched left three possibilities:
- The data were not actually fake (i.e., we were wrong)
- The data had been tampered on the Qualtrics server
- The data had been faked during data collection (before going on the server).
Regarding possibility #2. Qualtrics does allow authors to directly edit and delete values after data are collected, on the Qualtrics server. For example, you can run a Qualtrics survey asking people “who will you vote for in the next election?”. A participant could write down “None of your damn business” and you, as the experimenter and owner of the Qualtrics survey, could change their answer to “Biden, thanks for asking.” So researchers can fabricate data directly on the Qualtrics server.
But not without leaving a trace.
Edits are flagged by Qualtrics. If you did change the answer to “Biden, thanks for asking”, the cell containing that edited answer would show a little notch to show that it has been altered. See example below.
Fig 0. Screenshot showing how Qualtrics flags data edited on the server.
For this study, the data on the Qualtrics server did not have those markings, indicating that the data had not been edited. Possibility #2 was ruled out.
This left the two other possibilities: either no fraud, or fraud before Qualtrics. The analyses that follow suggested to us that it was the latter. Specifically, we concluded that one person impersonated participants using three different computers simultaneously, inside the same lab where the study supposedly took place.
The original study design
The study was run in sessions of three simultaneous participants. Participant 2 was a confederate (who coughed so as to trigger concerns about being contagious). Participants 1 and 3 were supposedly real student participants. According to the study procedure the three participants entered the lab together, sat down next to each other, and completed a Qualtrics survey on three separate computers. They did not interact with one another. The study was run in three waves. The first two waves, run in February and March, did not show an effect of lighting on perceived risk of transmission of a contagious disease. We believed those sessions had real participants. A third wave, run in May, produced the published effect.
We suspected that the data were faked in that third wave1We think that maybe the first few observations in that wave are real., by someone impersonating actual participants and completing the survey in a way that produced the desired result. The analyses below document five facts that we interpret as pointing to an impersonator.
Code and data to reproduce the analyses available from: https://ResearchBox.org/2936
Fact 1. Time gaps getting started
Recall that, according to the study protocol, participants entered the lab in groups of three, and then began the Qualtrics survey when prompted. In waves 1 and 2, we find that participants in the same session started the survey at almost the exact same time: The median gap between start times was 0 seconds. This is consistent with different people being seated at their assigned desks, and starting the survey when instructed.
But in the suspicious wave 3, there is a considerable gap between start times of participants in the same session2A t-test of that difference is statistically significant; a resampling test with 1 million simulations never showed a difference even close to as extreme as the one we observe.. We believe this time gap is evident because of the time it took an impersonator to move between computers, a move that is not necessary when there actually is a different person in front of each computer.
Fig 1. Gaps between start-times of participants get larger in Wave 3
Fact 2. Order
Next we looked at the order in which participants clicked on the link to begin their surveys. There are six possible orders in which 3 people can start a task (e.g., 1 2 3, 2 3 1, etc.), and then seven more when we consider ties. One would expect the order to vary randomly across sessions, as there is no reason to expect the person seated at one computer to be faster to start than a person seated at another. And this is indeed what we see for waves 1 & 2. But in wave 3, the order was exactly the same for the last 15 sessions. This is consistent with a fraudster always moving from one computer to another in the same order (say from left-most to right-most).
Figure 2. Participants in Wave 3 have a predictable order of participants 3The day this post went live, a reader, Matthias Urlichs, alerted me to an error in the figure which has been fixed: the y-axis label '2_1_3' appeared twice, it has been replaced for '2_3_1'
Fact 3. Correlated survey duration
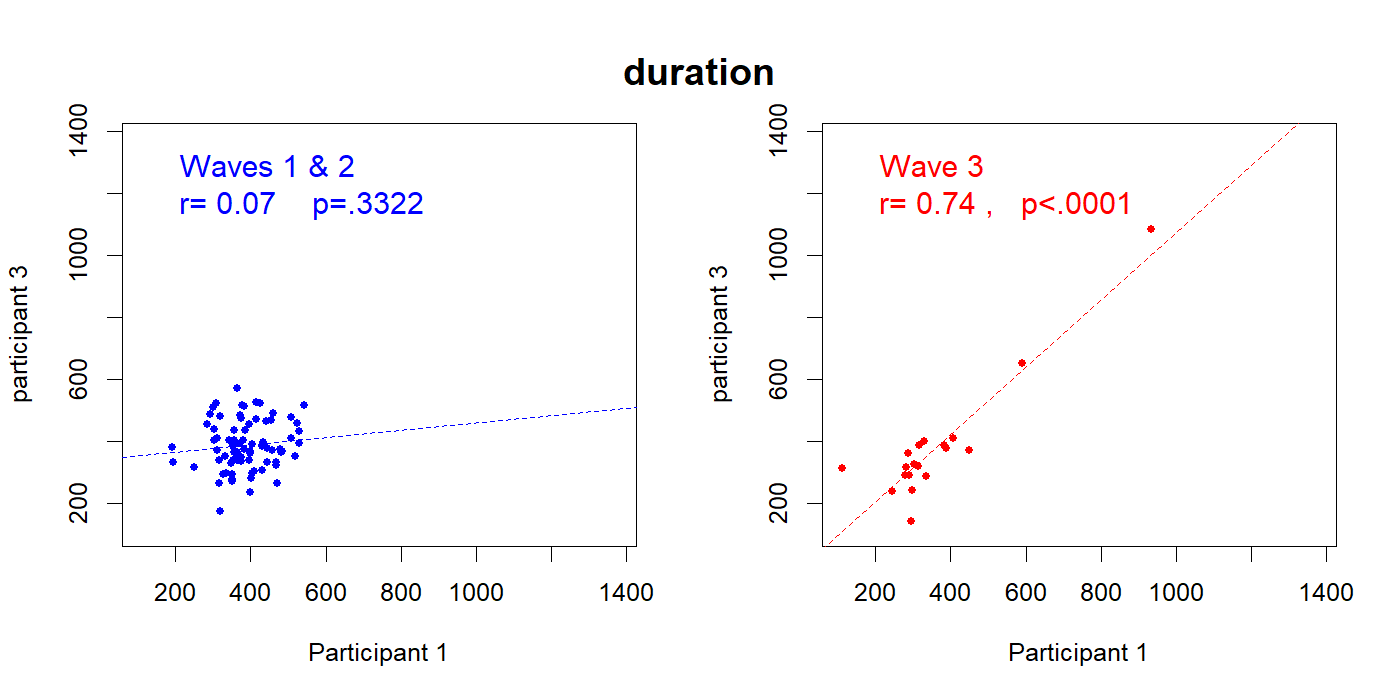
If Participants 1 and 3 were different people working independently, we would expect the duration of their surveys to be largely uncorrelated. If in a session participant 1 takes a bit longer, there is no reason for participant 3 to take longer also. The survey is not interactive. At the very least, we should not expect this correlation to be larger in wave 3. But, if one bad actor is impersonating three participants, in contrast, duration may be correlated if that person is entering the answers in all three surveys before submitting all three surveys.
In waves 1 and 2, survey duration is indeed uncorrelated across participants in a session (rpearson=.11 ; rspearman=.07).
In wave 3 it is highly correlated (rpearson=.92 ; rspearman=.74)4If one eliminates the two observations in wave 3 with durations above 600 seconds, the two 'outliers' in the right graph, the spearman correlation is rspearman=.63, p = .0065..

Fig 3. Participants within same session have correlated time-to-complete-survey, only in Wave 3
Fact 4. Correlated Mediator and Dependent Variables
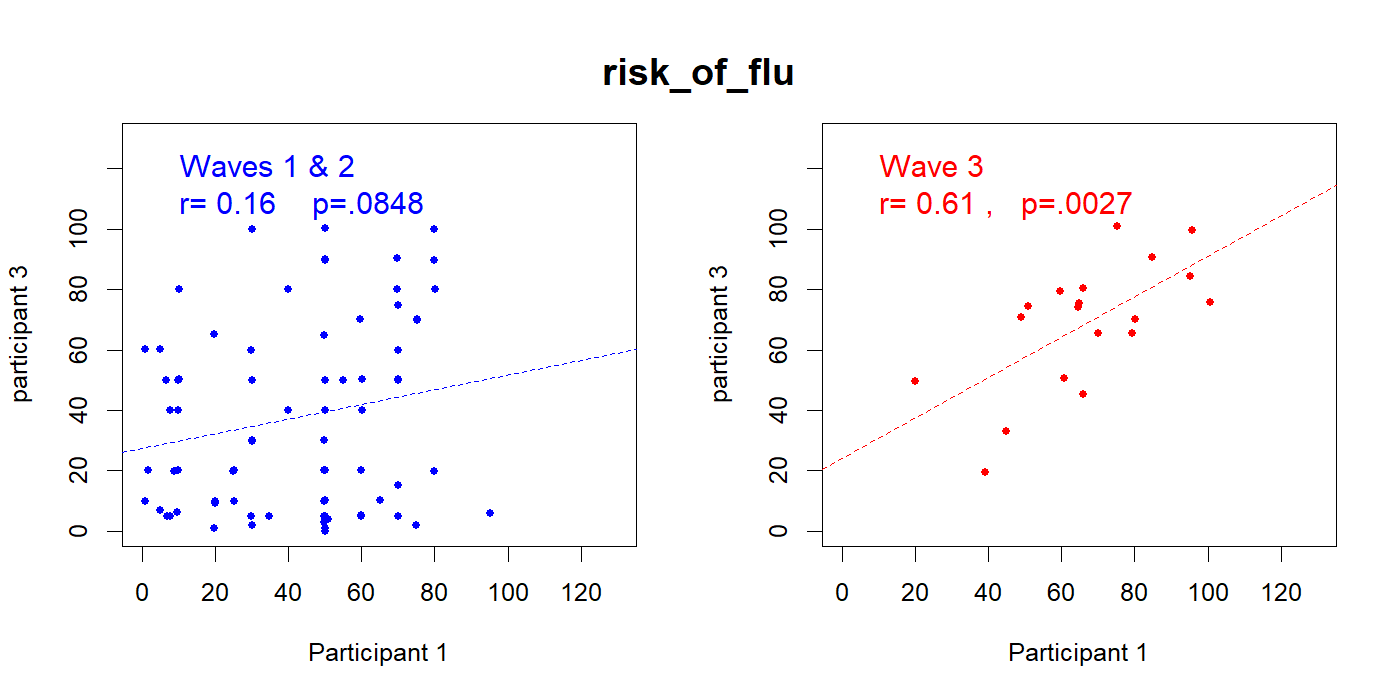
Similarly, we wouldn't expect the survey answers from different people working independently to be correlated. Indeed, in waves 1 and 2 the answers by participant 1 and participant 3 are not correlated. But in wave 3 the answers given are highly correlated (I rule out a benign explanation in the footnote5One benign explanation for a correlation between participants in the same sessions is a time-varying variable that affects both participants. For instance, one of the key questions involved fear of getting the flu which could for example be higher among people who show up in the morning. We addressed this possibility by running regressions predicting Participant 1 with Participant 3, controlling for the response of Participant 1 in the previous session (i.e., y1=a*y3+b*lag[y1]). The coefficient for lag was not significant for any of the three variables (duration, DV, mediator), while the other participant remained a significant predictor: p=2×10⁻⁷, p=.005 and p=.006. See Section #3.4 in posted R Code)).

Fig 4. Participants within same session have correlated fear of getting flu, only in wave 3
Fact 5. One participant is implausibly fast, another implausibly slow
In a couple of wave 3 sessions, timestamps of when people started and ended the survey make it implausible that the different surveys were actually taken by different people. There are two cases.
Case 1: Too Fast.
Below is screenshot of the data we analyzed.

Fig 5. Annotated screenshot of data #1
Participant 3 in session #85 started the survey a mere 4 seconds after Participant 3 ended session #84 (the IP address shows it was the same computer). So, this means the following: in 4 seconds, one person needed to click submit, get up, let another person sit down, sign the consent form, reload the URL for the survey, and click the link to start the survey.
The fastest such transition in waves 1 and 2 was 245 seconds, so four minutes rather than four seconds. Making things more implausible, this breakneck speed switch would have needed to happen while Participants 1 and 2 from the previous session were still working on their surveys (they didn't finish until 2 minutes later). But, remember, they all were supposed to take the survey together (so that the confederate could cough near them).
Case 2: Too Slow
In Session 82, the confederate (Participant 2) started the survey after both participants had already finished it. This makes no sense because the whole point of the confederate is to cough while two real participants are next to them.

Fig 6. Annotated screenshot of data #1
CODA
Paragraph 70 in the U of Toronto report (.pdf) reads:
Retraction Watch noted that Dr. Labroo disputed the existence of such an email, but they indicated that "a spokesperson for the university confirmed [its] existence" (.htm).
Author feedback
Our policy (.htm) is to share drafts of blog posts with authors whose work we discuss, in order to solicit suggestions for things we should change prior to posting, and to invite them to write a response that we link to at the end of the post. We deviate from this policy from time to time. For example, having received anonymous threats last time I contacted all authors, this time I only reached out to Chen-Bo who made suggestions that improved the post.
![]()


