We recently presented evidence of data tampering in four retracted papers co-authored by Harvard Business School professor Francesca Gino. She is now suing the three of us (and Harvard University).
Gino’s lawsuit (.htm), like many lawsuits, contains a number of Exhibits that present information relevant to the case. For example, the lawsuit contains some Exhibits that present the original four posts that we wrote earlier this summer. The current post concerns three other Exhibits from her lawsuit (Exhibits 3, 4, and 5), which are the retraction requests that Harvard sent to the journals. Those requests were extremely detailed, and report specifics of what Harvard's investigators found.
Specifically, those Exhibits contain excerpts of a report by an "independent forensic firm" hired by Harvard. The firm compared data used to produce the results in the published papers to earlier versions of data files for the same studies. According to the Exhibits, those earlier data files were either (1) “original Qualtrics datasets”, (2) “earlier versions of the data”, or (3) “provided by [a] research assistant (RA) aiding with the study”. We have never had access to those earlier files, nor have we ever had access to the report that Harvard wrote summarizing the results of their investigation.
For all four studies, the forensic firm found consequential differences between the earlier and final versions of the data files, such that the final versions exhibited stronger effects in the hypothesized direction than did the earlier versions. The Exhibits contain some of the firm’s detailed evidence of the specific discrepancies between earlier and published versions of the datasets.
In this post we summarize what is in those Exhibits.
Colada[109] – "Clusterfake" (Shu et al., 2012, Study 1)
Shu et al. (2012) reported that people were less likely to cheat when they signed an honesty pledge at the top vs. bottom of a form.
The lawsuit’s Exhibit 3 (.pdf) compares the Published Data with “original” data files “provided by the research assistant (RA) aiding with the study” (p. 6).
Most relevant to our post (.htm), the Exhibit includes tables listing every observation that the forensic firm was able to match on both Participant ID and Condition between the RA’s data file and the Published Data (p. 7-9 | Screenshot .png). In total, the firm matched 90 of the 101 observations in the Published Data. There are thus 11 observations in that dataset that they could not match to the RA's data file, including "six participant IDs [that] are present in both [data files] but under different [experimental] conditions" (p. 6) [1].
In our post we had flagged nine observations as potentially having been tampered with. We flagged seven because they were out of order, and we flagged two because they had the same ID and the same demographic information. You can most easily see this in the .csv file accompanying our post (.csv), which contains a column called “flag”. Within that column, there is a '1' next to the nine flagged observations (more details in this footnote: [2]).
An interesting question is how many of the 8 participant IDs we flagged were in the list of 11 observations the forensic firm couldn't match to the earlier data. The answer is: all 8. The probability of us getting this right by chance is about 1 in a billion.
The table below documents our assertions. It lists all observations in the Published Data, indicating for each one whether both the ID and the condition match the RA's file. We highlight in yellow the 8 IDs we flagged. We interpret the information in that table to mean that all 8 IDs we flagged as suspicious were indeed tampered with.
As a separate point, in our post we wrote, “The evidence of fraud detailed in our report almost certainly represents a mere subset of the evidence that the Harvard investigators were able to uncover”. And indeed the forensic firm uncovered much more evidence of data tampering than we did. For example, they wrote that “52% of reported responses contained entries that were modified without apparent cause” (p. 6). We take this to mean that more than half of the observations were tampered with.
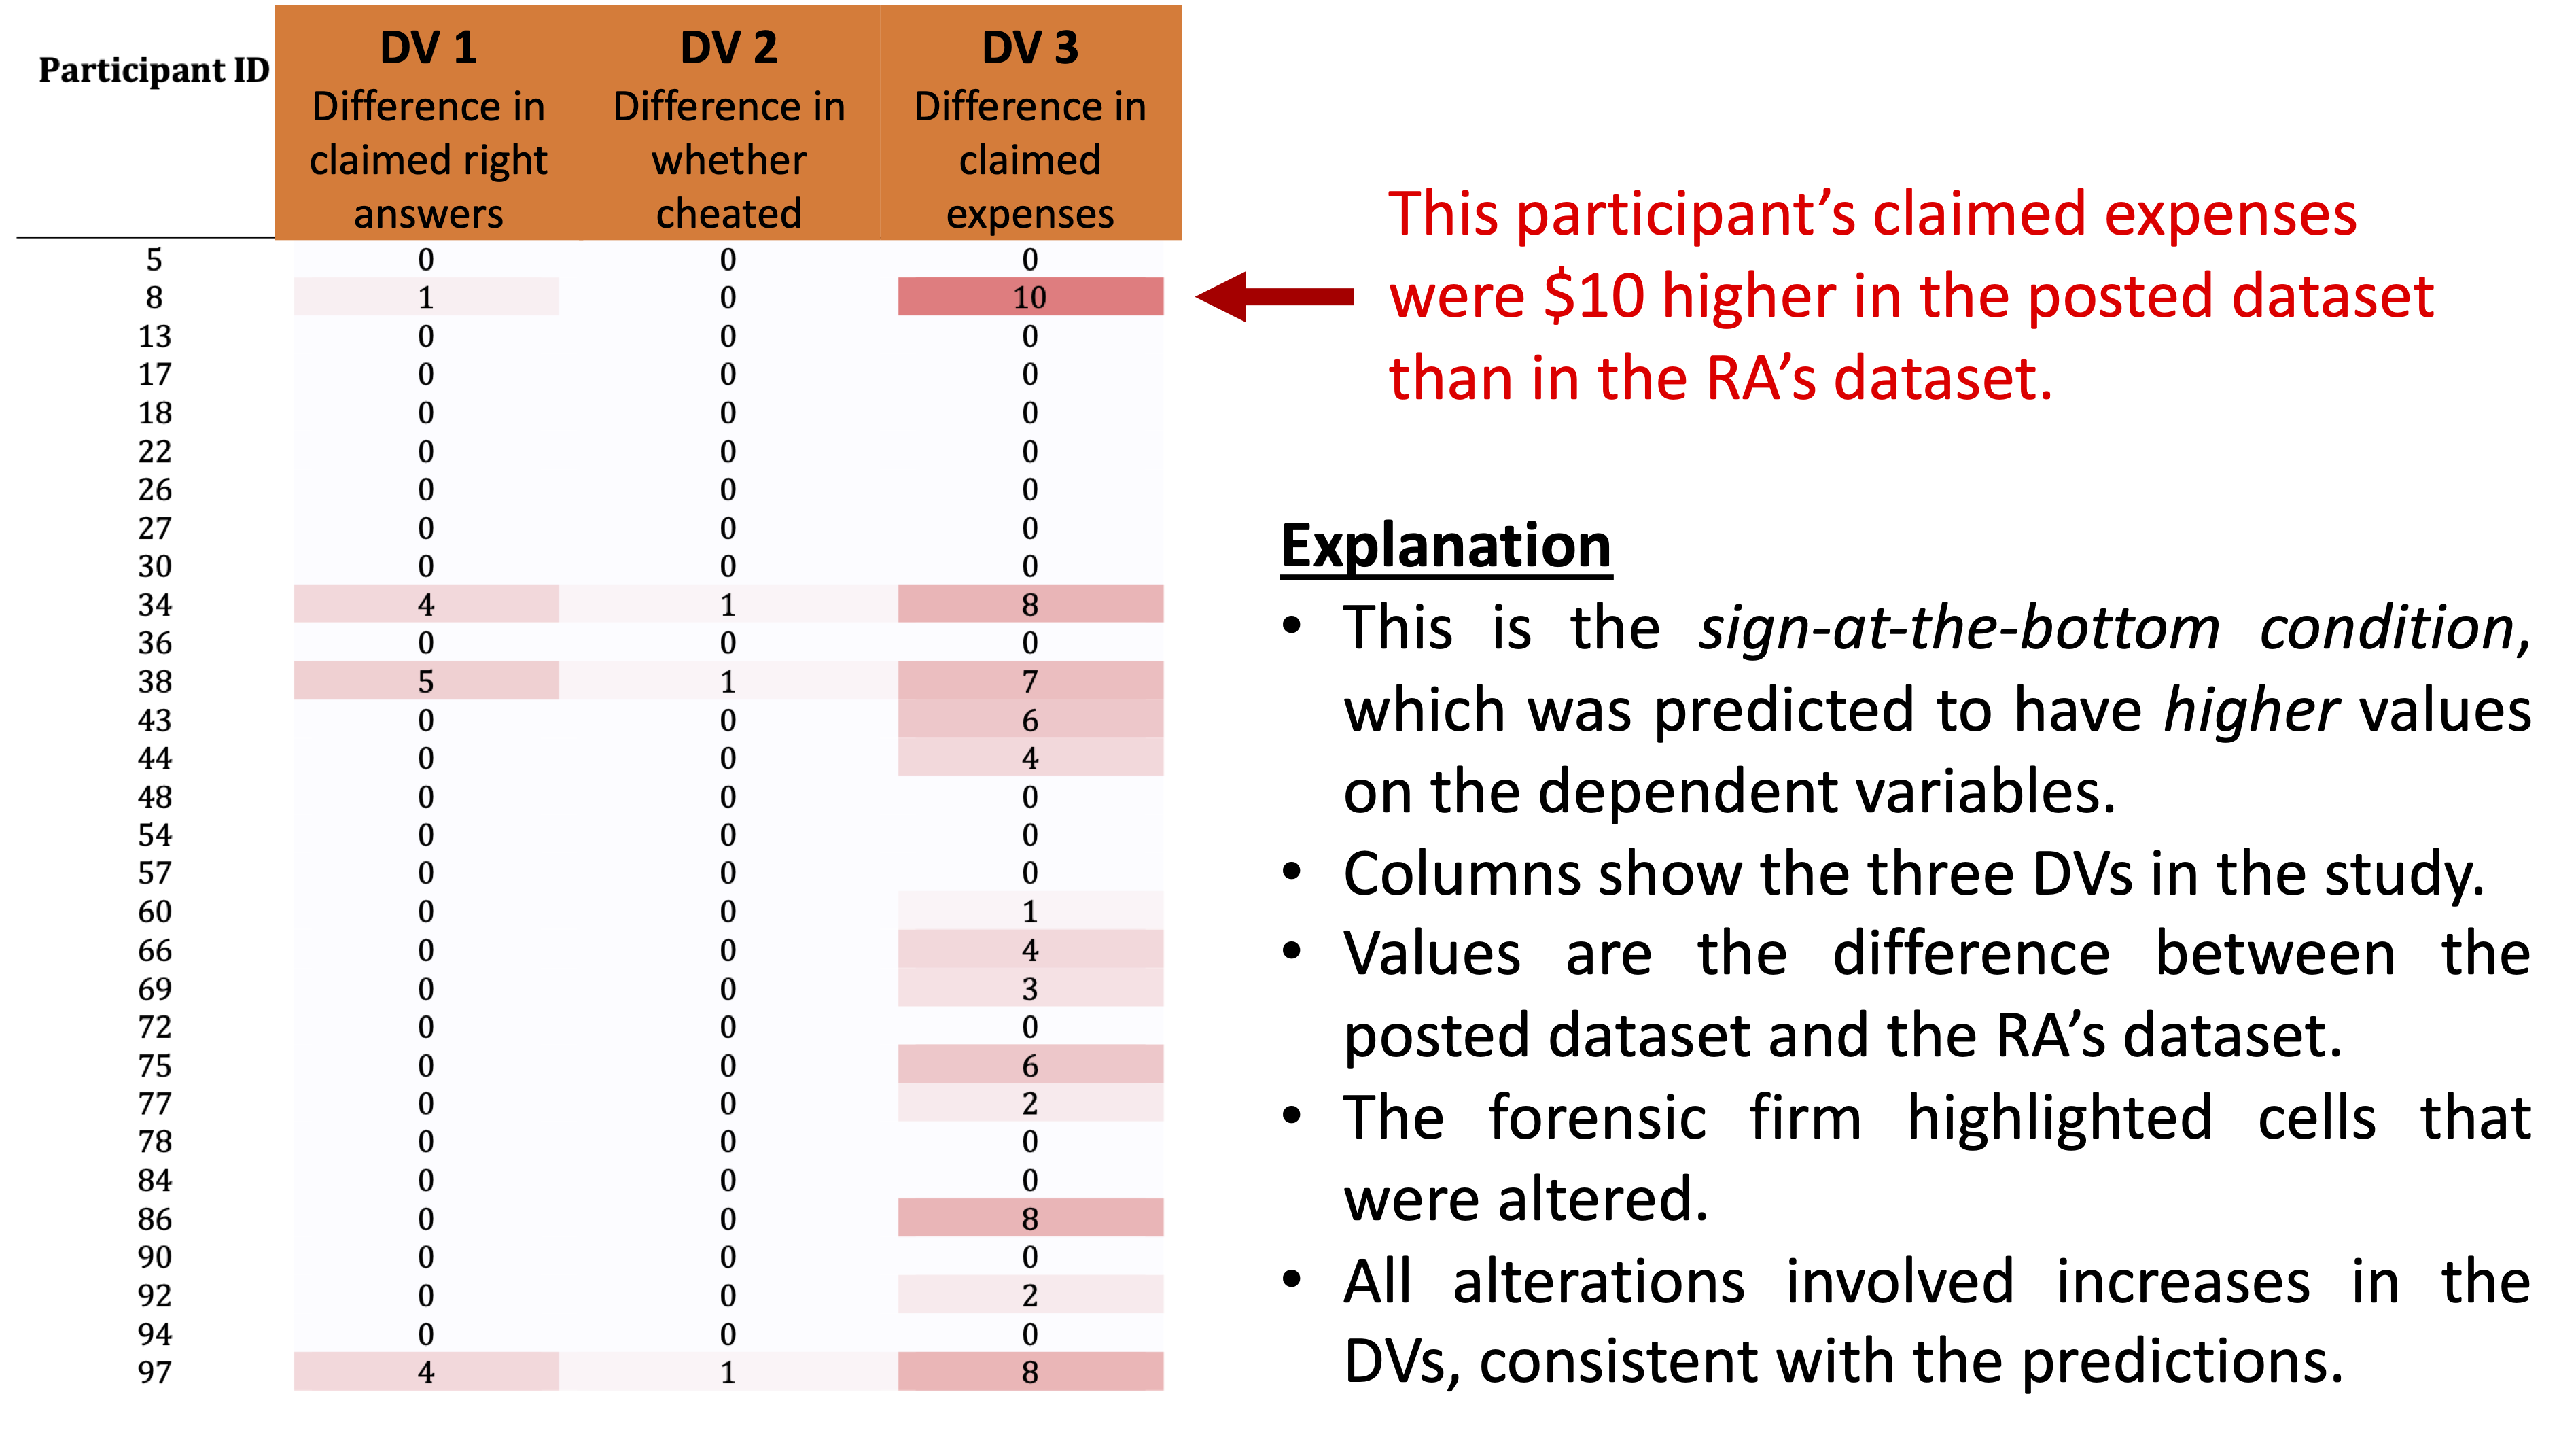
Indeed, the firm found evidence suggesting that many values of the dependent variables had been altered, and in a way that supported the authors’ hypothesis. For example, a table from the Exhibit (p. 9) that we annotate below shows the differences in the data files’ dependent variables for participants in the sign-at-the-bottom condition. This condition was predicted to have high values on the dependent variables, and all of this red highlighting in the Exhibit indicates the many values that were higher in the Published Data than in the file provided by the RA. Our interpretation of this evidence is that all of these red-highlighted values were manually increased after data were collected:

A similar figure (on p. 8) shows that many values in the sign-at-the-top condition – which were predicted to have low values – were lower in the Published Data than in the file provided by the RA.
Finally, the report also analyzes the data in the different files, in all cases finding that the effects are more significant (and in the hypothesized direction) in the Published Data than in the file provided from the RA [3].
Colada [110] – "My Class Year is Harvard" (Gino, Galinsky, & Kouchaki, 2015, Study 4)
Gino et al. (2015) reported that Harvard students were more likely to desire cleaning products after writing an essay arguing against their own position on a campus issue.
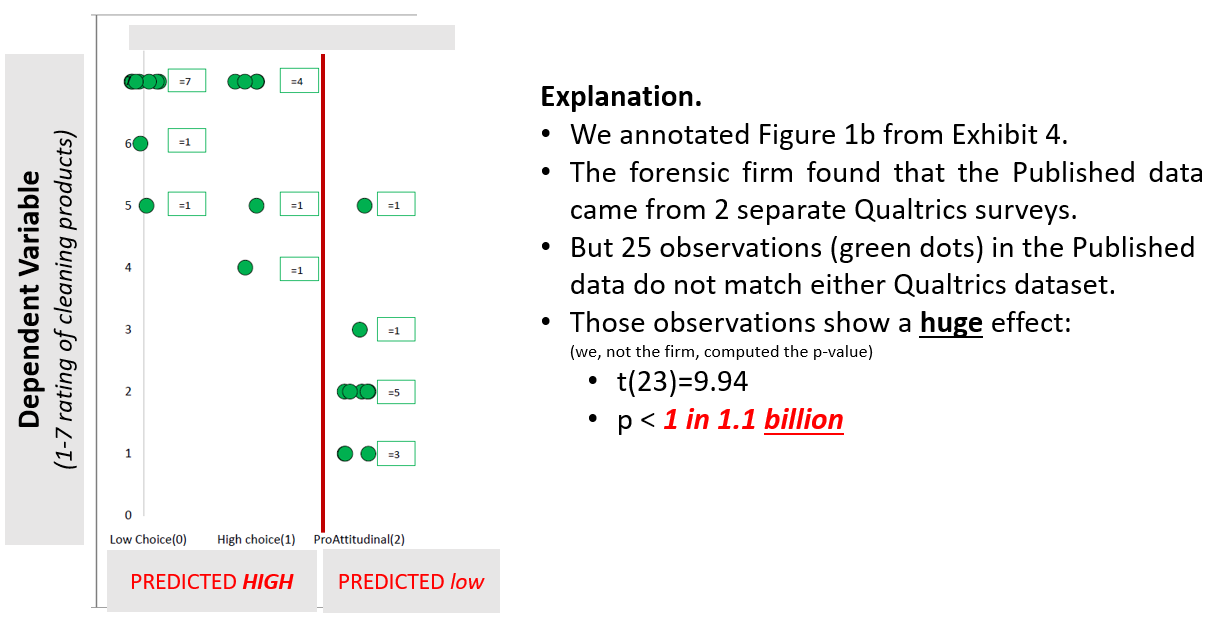
The lawsuit’s Exhibit 4 (.pdf; p. 2-13) compares “the original Qualtrics dataset” with the Published Data, which Gino posted to the OSF (p. 6). The firm matched most of the Published Data to two different Qualtrics surveys [4].
The first thing to note is that the firm could not determine the origin of 25 observations in the Published Data; those 25 observations did not match either Qualtrics survey. It turns out that those observations show an extremely strong effect, supporting the hypothesis of interest to the tune of p < 1 in 1.1 billion. See our annotated version of Figure 1b in Exhibit 4:
Overall, the report notes that the study’s critical effect – which was p < .001 in the Published Data – was not significant in the dataset created from the original Qualtrics files (ps > .86).
In our post (.htm), we discussed how 20 participants in the study had strangely answered ‘Harvard’ when asked to report their class year. Critically, we observed that those participants showed an extraordinarily large effect in the authors’ predicted direction.
The Exhibit indicates that one of the two Qualtrics files does contain 24 rows in which participants answered ‘Harvard’ for their class year. However, the Exhibit also appears to indicate that:
(1) only 20 of the 24 were copied from the original Qualtrics dataset to the Published Data, and
(2) 8 of these 20 'Harvard' rows had values altered [5].
In other words, if we are reading the Exhibit correctly, the ‘Harvard’ observations in the Published Data and the ‘Harvard’ observations in the original data are different.
Finally, Exhibit 4 documents much more evidence of tampering than we had uncovered, with many other (non-‘Harvard’) observations having been altered (or selectively included/excluded), in ways that contributed to the published findings.
Colada[111] – The Cheaters Are Out of Order (Gino & Wiltermuth, 2014, Study 4)
Gino and Wiltermuth (2014) reported that people who cheated on one task were more creative on subsequent unrelated tasks.
The lawsuit’s Exhibit 4 (p. 14-24) compares the “data that was the basis for the published research” with “earlier versions of the data” (p. 20). The Exhibit says that both versions of the data “were created in 2012 by Dr. Gino, and last saved by Dr. Gino, according to their Excel properties” (p. 19).
In our post (.htm), we focused on how the data for one of the creativity measures – number of original uses of a newspaper – were almost perfectly sorted within each condition, but with 13 out-of-order observations that we hypothesized to have been tampered with. Unfortunately, this Exhibit does not present analyses of that variable, and so we cannot evaluate our narrow conjectures here. The Exhibit instead focuses on a different dependent variable, one that we did not discuss: participants’ performance on the Remote Associates Task [6]. It also shows evidence that the independent variable – whether or not a participant cheated – was tampered with.
Indeed, the Exhibit includes an interesting screenshot of that earlier Excel file.
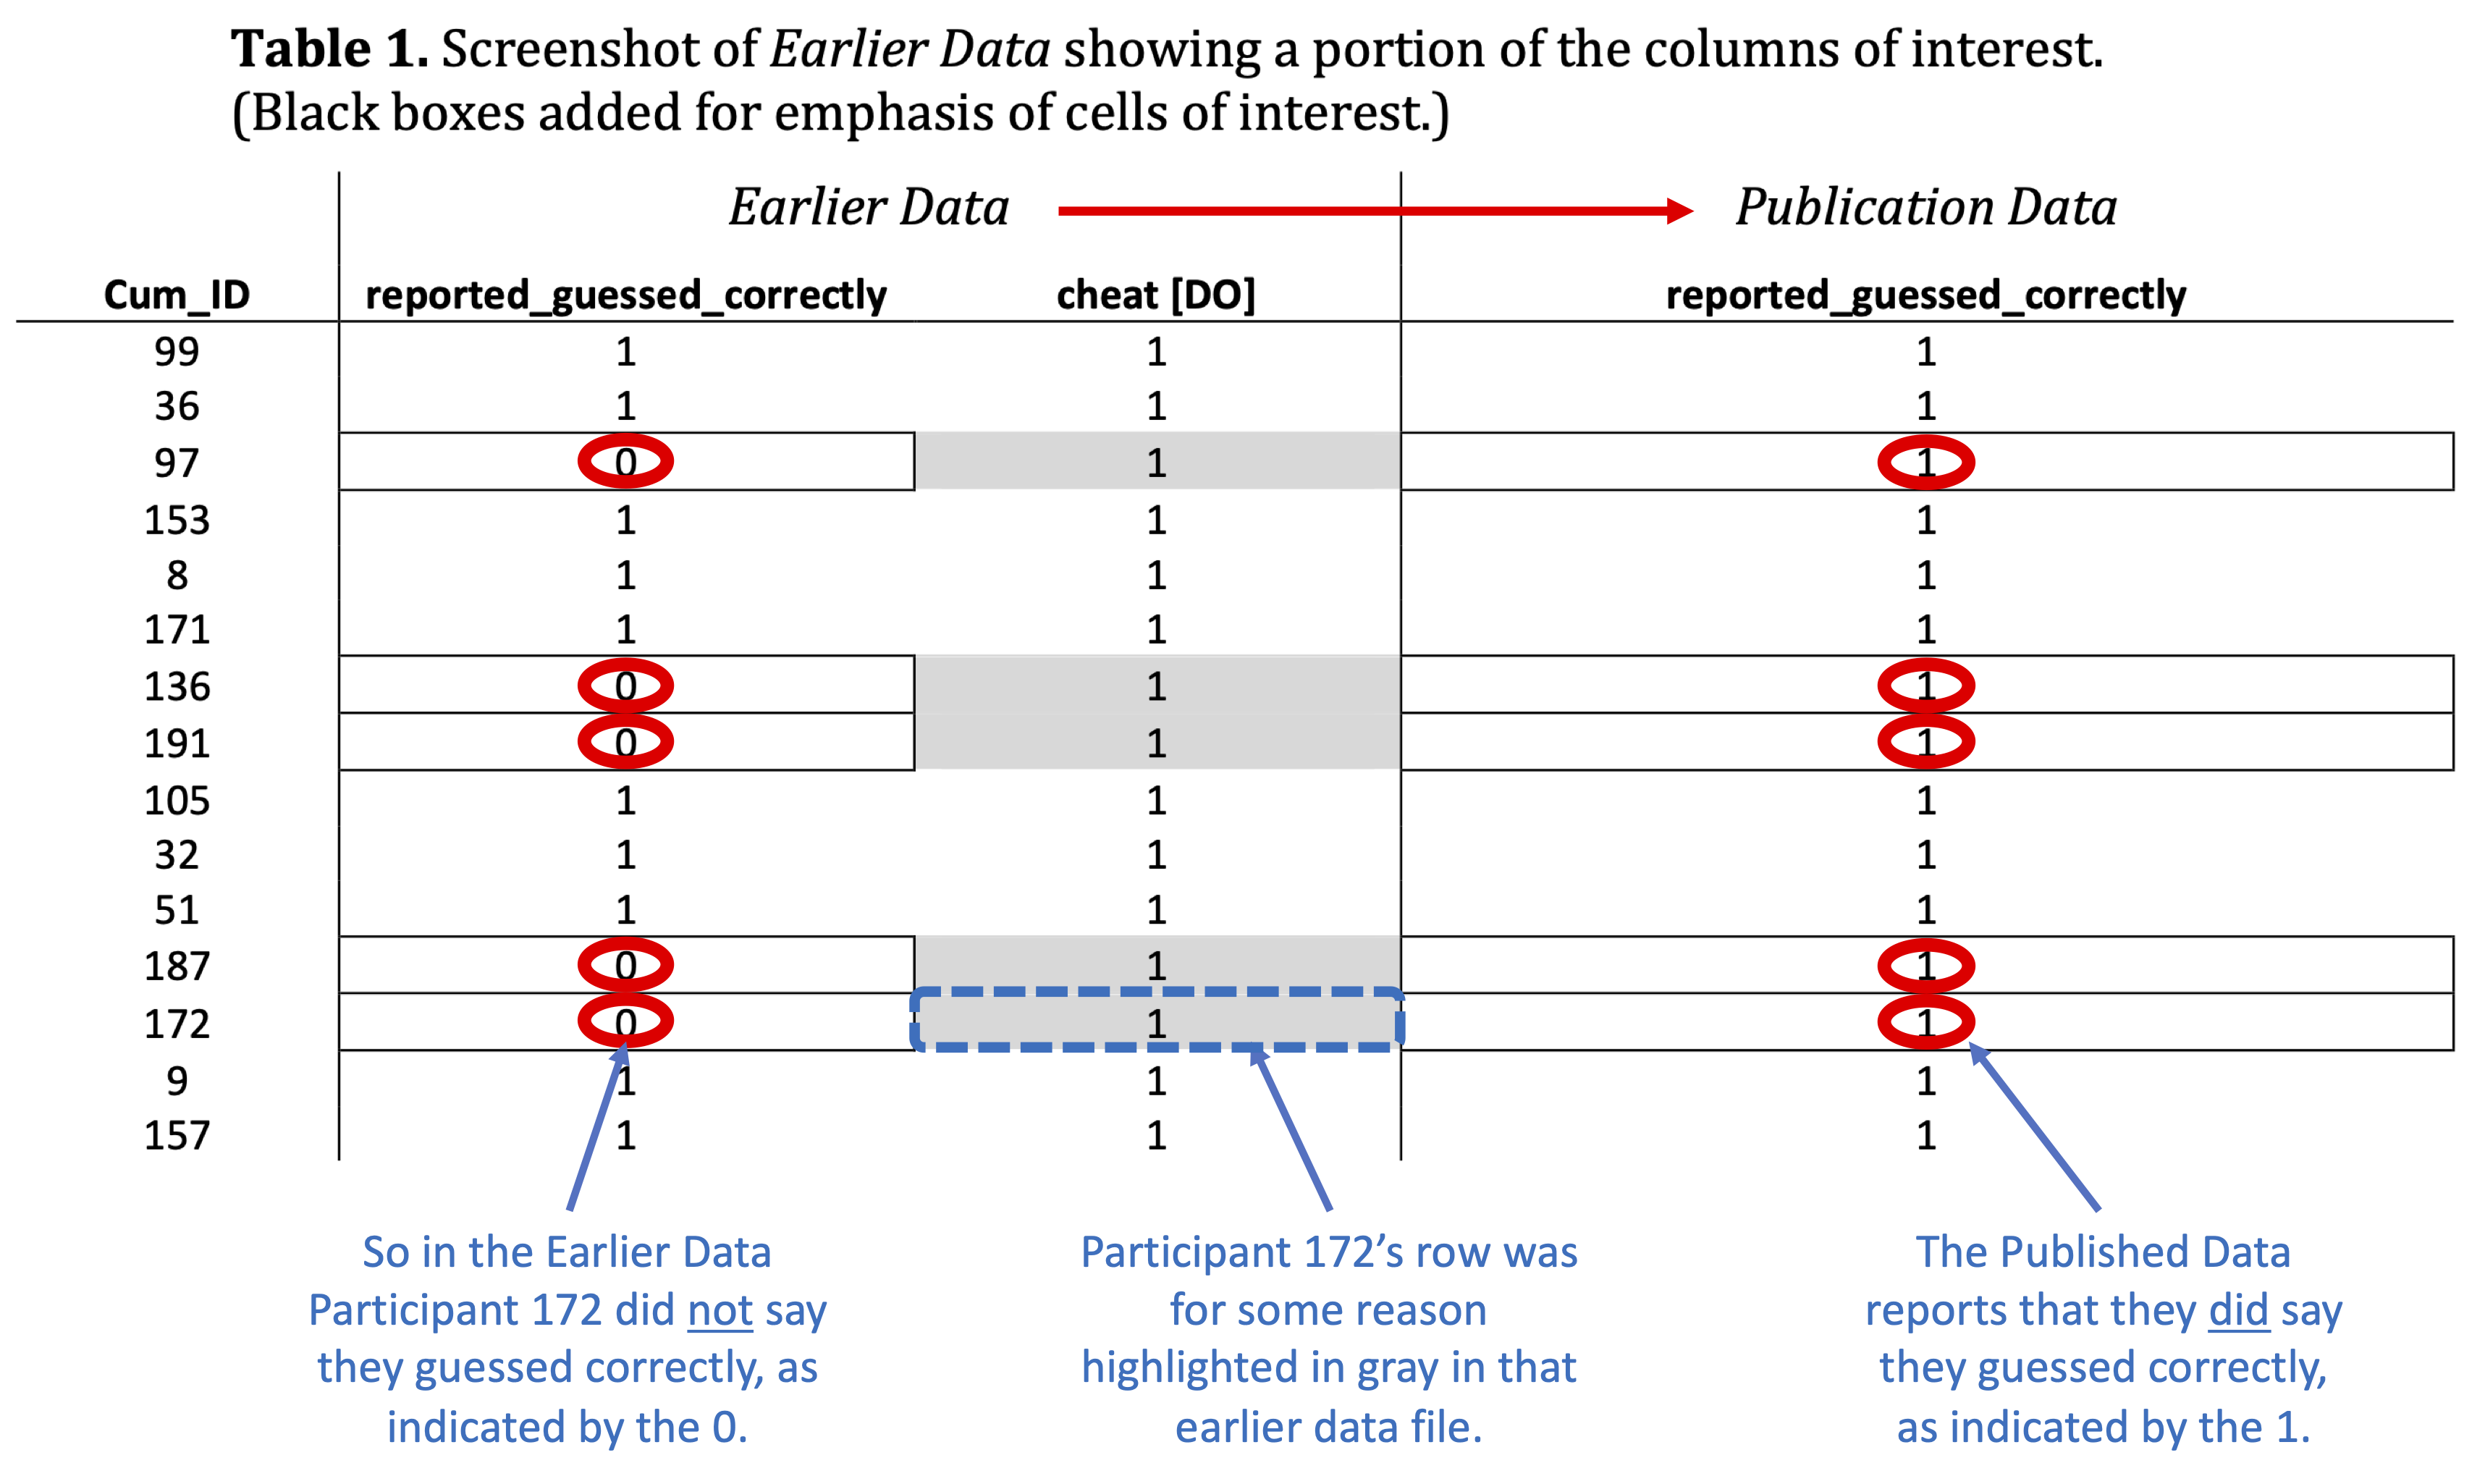
In that earlier Excel file itself, some values were highlighted in gray, and those very observations are ones that differed between the earlier and later versions of the file. In other words, it appears that someone had highlighted some of the observations that were subsequently changed to create the published version of the Excel file.
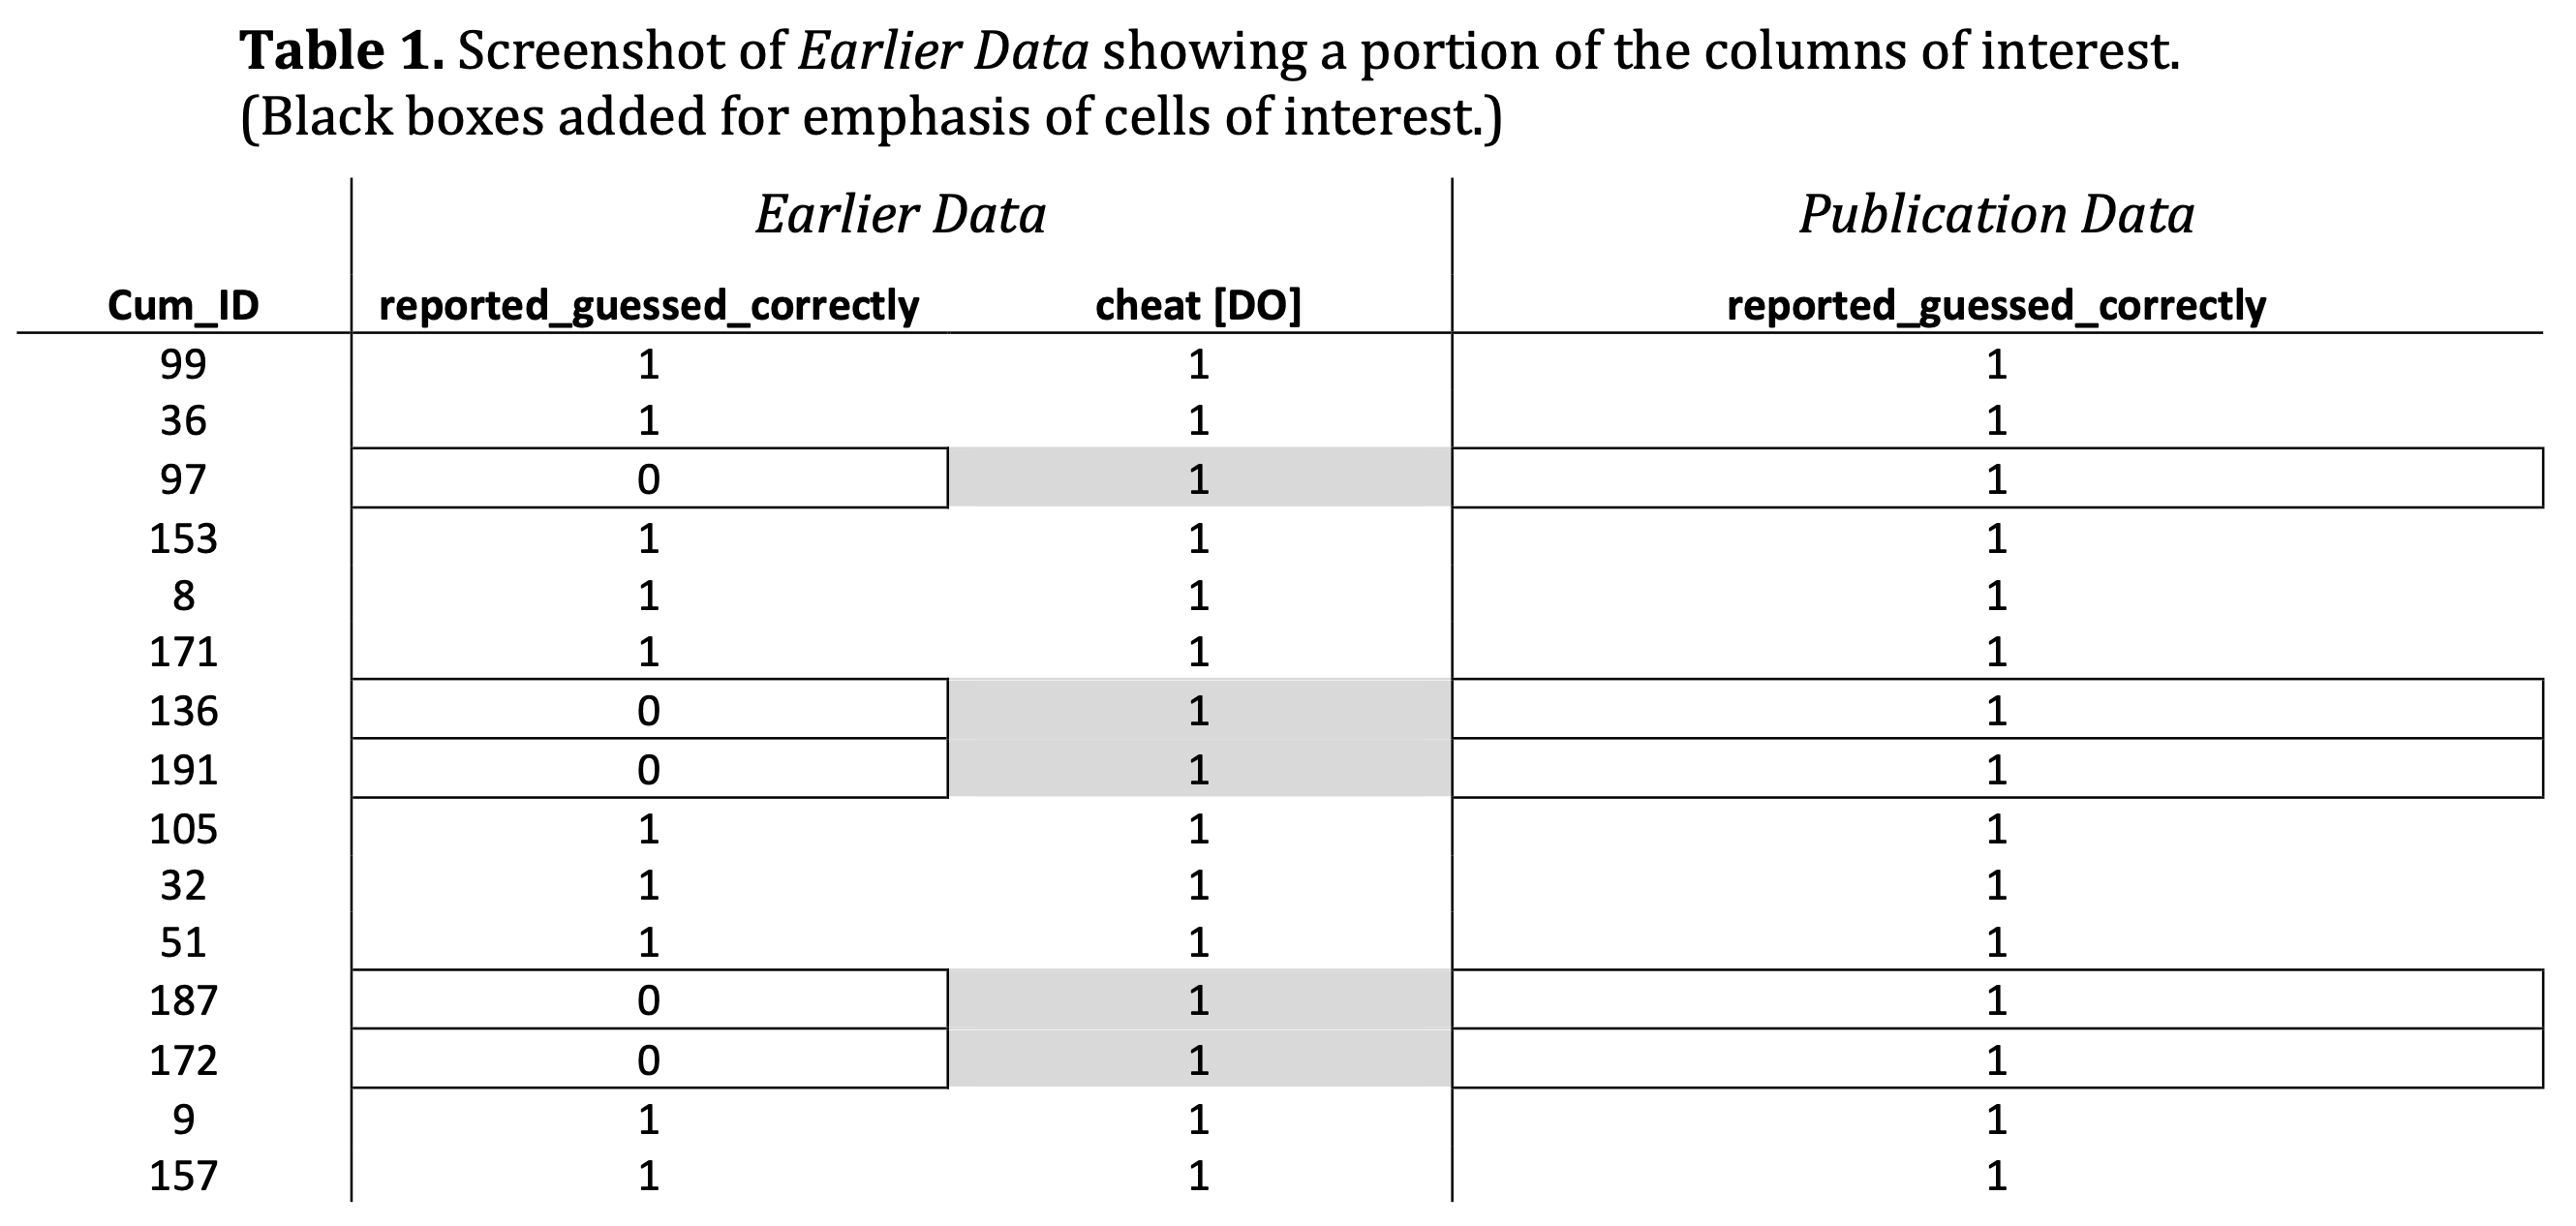
Below is a table from the Exhibit. But it is important to emphasize this is not a table created by the "independent forensic firm". It is instead a screenshot from the earlier version of the Excel file. So, according to the Exhibit, the gray highlighting that you see here was actually in the Excel file itself:

And now below we’re presenting an annotated version of that same screenshot, which more explicitly shows that the observations that were highlighted in gray in the Earlier Data were changed from 0s to 1s in the column (“reported_guessed_correctly”) indicating whether or not a participant said that they correctly guessed the results of a coin toss during the cheating task:

This Exhibit presents much more evidence of tampering as well, including the fact that although performance on the Remote Associates Task differed significantly among cheaters vs. non-cheaters in the Published Data, it did not differ significantly in the Earlier Data (see Tables 4 and 5 on p. 23).
Colada[112] – Forgetting The Words (Gino, Kouchaki, & Casciaro (2020), Study 3a)
Gino et al. (2020) reported that people were more likely to think that a networking event was morally impure when they were in a “prevention-focus” (having written about duties or obligations) than when they were in a “promotion-focus” (having written about hopes and aspirations).
Exhibit 5 (.pdf) in the lawsuit compares the Published Data (posted by Gino to the OSF) to the “original Qualtrics dataset” (p. 8).
In the study, participants considered a networking event, rated (on seven 7-point scales) how morally impure the event would make them feel, and wrote “words that came to mind while you were reflecting on [the networking event]” (original materials of Study 3a (.htm)). In the post (.htm), we pointed out that there were potentially telling instances in which the words that participants wrote seemed to contradict the ratings that they gave. For example, there are many instances in which participants wrote negative things about the networking event – calling it “Gross” or “Slimy” – but whose ratings indicated that the event did not make them feel dirty or impure at all.
In order to identify the presence or absence of data tampering, it is helpful to be able to directly match rows from the original data to rows from the Published Data. Fortunately, in this case the matching can be done perfectly. Every original participant wrote essays and reflections about various things. Those responses are so idiosyncratic that they functionally present an individual fingerprint for each participant in the study. Now, with that matched fingerprint between the original and the published data, the investigators could look to see if any other values had been tampered with. They had been.
In the post we hypothesized two forms of data tampering.
First, we hypothesized that some observations in the Promotion condition were altered such that ”higher values were manually changed to 1.0s.” Exhibit 5 seems to confirm that conjecture. Here's an example of an observation from that Exhibit, annotated by us for your convenience:

You can see that across the two datasets, these two rows are from the same participant: they have exactly the same essay, hope/aspiration, and reflection on the networking party. But the ratings were altered. And in a direction that helped to produce the overall effect, from higher values to all 1s.
We also conjectured that some of the “prevention” condition observations were altered to produce higher numbers. And Exhibit 5 shows examples of this as well:

Of course, these observations are not the only ones that appear to have been altered; the forensic firm identified 168 of them [7].
![]()
Footnotes.
- They do not list the 11 observations that they couldn't match, but it was straightforward to find them: They are the observations that are in the Published Data, but not in the tables contained in the Exhibit, which only include the 90 observations that the firm matched between the two datasets. [↩]
- Details on the flagged IDs in Post 1 "Clusterfake"
We flagged seven observations for being out of order either individually (ID 64), or within a set of six. We also flagged two observations for appearing in contiguous rows, with the same participant ID (#49) and "with identical demographic information" (Colada [109]). Both #49 participants were 21-year-old males who majored in English. Thus, we flagged eight participant IDs and nine observations. We did not flag Participant #13, whose ID appears twice in the dataset, because they had different demographics (a 26-year-old female who majored in Library Science vs. a 20-year-old female who majored in Chemistry). Given that the rows appear far apart in the data, with different demographic information, we suspected that this duplicate ID #13 may have been an innocent data entry error. Importantly, Exhibit 3 suggests that we were right. In the data file sent by the RA, there was only *one* Participant 49 (suggesting it was duplicated after the RA sent the data), but two Participant 13s (suggesting it was not duplicated after the RA sent the data). [↩] - Dropping tampered observations does not eliminate bias.
The forensics firm's recalculations of the paper's key results based on the data provided by the RA are likely to overstate the size of the effects even in that dataset, because those results were computed on a sample that excluded the 11 observations that either had a condition switched or that could not be matched to the dataset sent by the RA. In other words, some of the probably-tampered-with observations were removed from these analyses, and this, counterintuitively, does not eliminate the bias tampering caused.This figure illustrates how the bias may persist when observations that were switched across conditions to produce a fake finding are simply dropped:

If you don't have an intuition for this, imagine you roll a six-sided die many times and you never want it to come up six. So every time it comes up six you change it to a one. If you were to remove all of the sixes that you changed to ones, and then compute the average of the die-roll outcomes, that average will be biased downward, because it will contain only 1s, 2s, 3s, 4s, and 5s, and no 6s. The same logic applies here. When you remove the tampered-with observations, you may be removing the very observations that were most problematic for the researchers’ hypothesis.). [↩]
- Those two surveys had different numbers of columns/variables (69 vs. 109). There isn't anything in the original article suggesting that the data came from two separate surveys, and therefore no explanation as to why there is a difference in the number of variables contained in these two datasets. [↩]
- The Exhibit says, “The 24 participants who wrote ‘harvard’ as school year in the ONLINE [Original Qualtrics] data did not correspond exactly with those in the OSF [Published] data (e.g., 8 of the OSF entries used in the paper ≠ ONLINE [Original Qualtrics] entries for ‘harvard’).” (p. 10). [↩]
- The Remote Associates Task “measures creativity by assessing people’s ability to identify associations between words that are normally associated. Each item consists of a set of three words (e.g., sore, shoulder, sweat), and participants must find a word that is logically linked to them (cold)” (Gino & Wiltermuth (2014), p. 974-975). [↩]
- Exhibit 5 says, “In total, 168 scores for moral impurity or net intentions appear to have been modified” (p. 12). [↩]

