Today Psychological Science issued a Corrigendum (.htm) and an expression of concern (htm) for a paper originally posted online in May 2018 (.htm). This post will spell out the data irregularities we uncovered that eventually led to the two postings from the journal today. We are not convinced that those postings are sufficient.
It is important to say at the outset we have not identified who is responsible for the problems. In the correction, for example, the authors themselves make clear that they "do not have an explanation" for some peculiarities, in part because many other people handled the data between collection and reporting. This post is therefore not about who caused the problems [1].
R Code to reproduce all calculations and figures.
Background
The history of the correction starts back in May, in a Shanghai journal club discussion Leif participated in while on sabbatical in China. Puzzled by a few oddities, four members of the group – Frank Yu (.htm), Leif, and two other anonymous researchers – went on to consider the original data posted by the authors (.htm) and identified several patterns that were objectively, instead of merely intuitively, problematic.
Most notably, the posted data has two classic markers of data implausibility:
(i) anomalous distribution of last digits, and
(ii) means are excessively similar.
Leif and his team first went to Uri for his independent assessment of the data, who concurred that the problems looked significant and added new analyses. Then, back in June, they contacted Steve Lindsay (.html), the editor of Psychological Science. In consultation with the editor, the authors then wrote a correction. We deemed this correction to be insufficient and we drafted a blog post. We shared it with the authors and the editor. They asked us to wait while they considered our arguments further. We promised we would, and we did. Eventually they wrote an expression of concern, to be published alongside the Corrigendum, and they shared it with us. Today, six months after we first contacted the editor, we publish this post, in part because these responses (1) seem insufficient given the gravity of the irregularities, and (2) do not convey the irregularities clearly enough for readers to understand their gravity.
The basic design in the original paper.
Li (htm), Sun (htm), & Chen, report three field experiments showing that the Decoy Effect – a classic finding from decision research [2] – can be used as a nudge to increase the use of hand‑sanitizer by food factory workers.
In the experiments, the authors manipulate the set of sanitizer dispensers available, and measure the amount of sanitizer used, by weighing the dispensers at the end of each day. There is one observation per worker-day.
For example, in Experiment 1, some workers only had a spray dispenser, while others had two dispensers, both the spray dispenser and a squeeze-bottle:
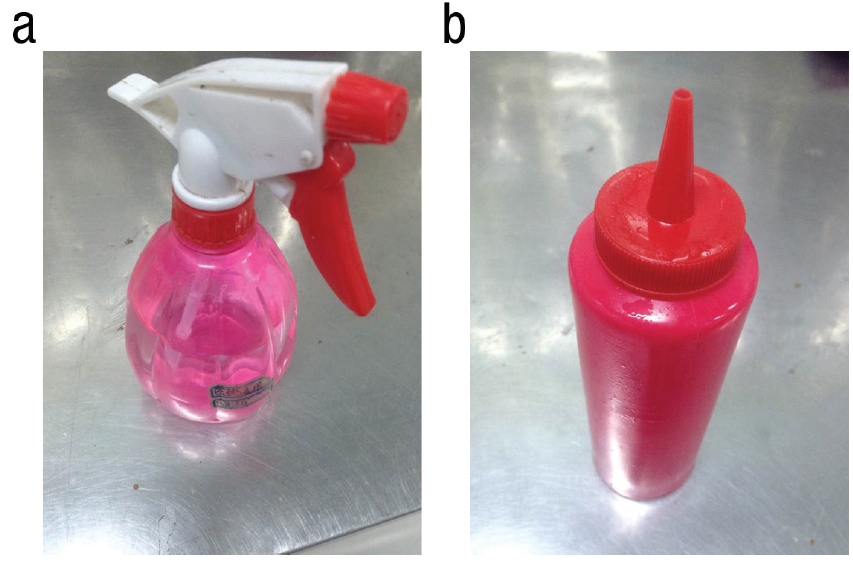
The authors postulated that the squeeze-bottle sanitizer was objectively inferior to the spray, and that it would serve as a decoy. Thus, the authors predicted that workers would be more likely to use the spray dispenser when it was next to the squeeze bottle than when it was the only dispenser available [3].
Original results: Huge effects.
Across three studies, the presence of a decoy dispenser increased the use of the spray dispenser by more than 1 standard deviation on average (d = 1.06). That's a large effect. Notably, in Study 2, only one participant in the control condition increased sanitizer use more than the participant who increased the least in the treatment. Almost non-overlapping distributions.
Problem 1. Inconsistency in scale precision.
The original article indicated that the experimenters used "an electronic scale accurate to 5 grams" (p.4). Such a scale could measure 15 grams, or 20 grams, but not 17 grams. Contradicting this description, the posted data has many observations (8.4% of them) that were not multiples of 5.
The correction states that scales accurate to 1, 2 and 3 grams may have been used sometimes, instead of scales precise to 5 grams (We do not believe scales precise to 3 grams exist). [4].
Problem 2. Last digit in Experiment 1
But there is another odd thing about the data purportedly obtained with the more precise scales. The problem involves the frequency of the last digit in the number of grams (by last digit we mean, for example, the 8, in 2018).
In particular, the problem with those observations draws on the generalization of something called “Benford’s Law”, which tells us the last digit should be distributed (nearly) uniformly: there should be just about as many workers using sanitizer amounts that end in 3 grams (e.g, 23 or 43 grams), as in 4 (e.g., 24 or 44 grams), etc. But as we see below, the data looks nothing like the uniform distribution. (If you are not familiar with Benford's law, read this footnote: [5]).
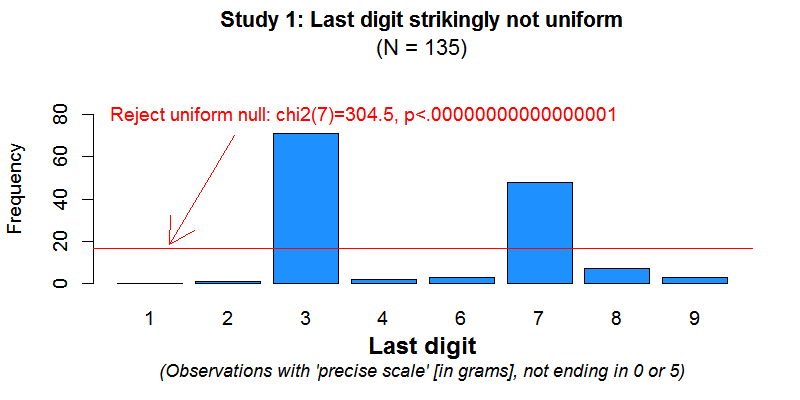
Fig 1. Histogram for last digit in Study 1 [6].
About this problem, the expression of concern reads:
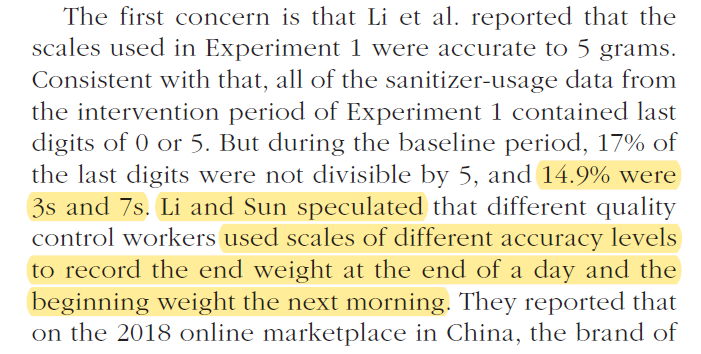
This speculated behavior, one scale precise to 5 grams used in the morning, another precise to 1 or 2 grams in the afternoon, or vice versa, cannot explain the posted data. A uniform distribution of last digits is anyway expected, not the bizarre prevalence of 3s and 7s that we see (R Code).
Problem 3. Last digit in Experiment 3.
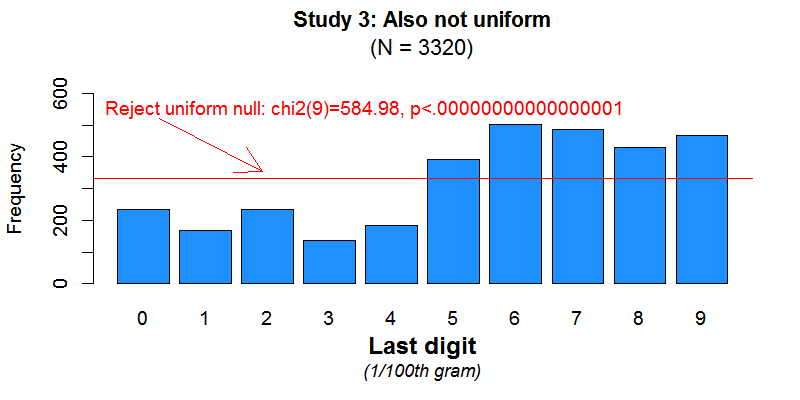
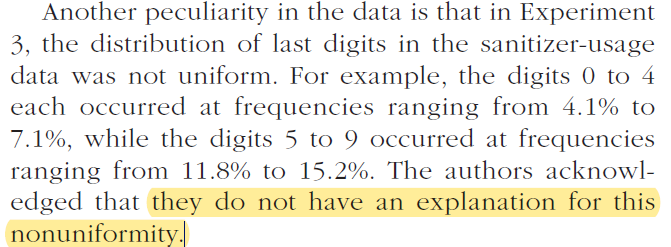
Let's look at the last digit again. In this study sanitizer use was measured for 80 participants over 40 days, and with a scale sensitive to the 100th of a gram. The expectation of the last digit being uniformly distributed here is more obvious.
To appreciate how implausible Fig 2 is, consider that it implies, for example, that workers would be 3 times as likely to use 45.56 grams of sanitizer, as they would be to use 45.53 grams [7].
About this problem, the expression of concern reads:
Problem 4. Implausibly similar means in Experiment 2
In Experiment 2, sanitizer use was measured daily for 40 participants for 40 days (20 days of baseline, 20 of treatment), all with a scale sensitive to 100th of a gram.
Recall that the manipulation was done at the room level. This figure, which was in the original article, shows the daily average use of sanitizer across the two rooms.
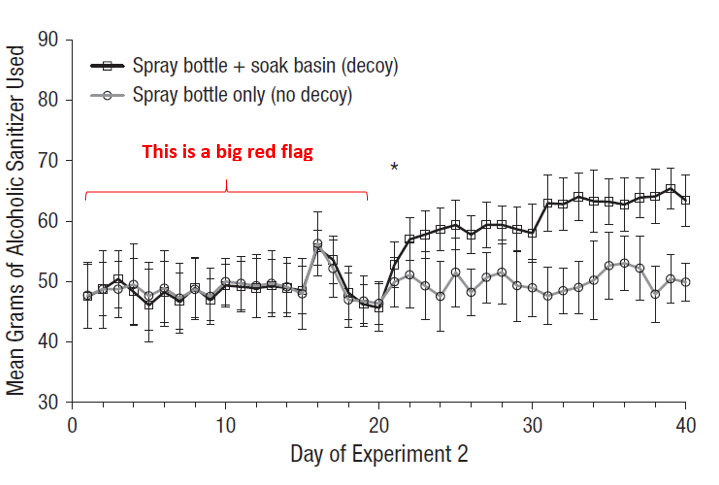
Treatment started on day 21. In days 1-20 the two rooms had extraordinarily similar means. Average sanitizer usage differed, on average, by just .19 grams across rooms. Moreover, across days, average sanitizer use was correlated at r = .94 across rooms.
To quantify how surprisingly similar the conditions were in the "before treatment" period, we conducted the following resampling test: we shuffle all 40 participants into two new groups of 20 (keeping all observations per worker fixed). We then compute daily means for each of the two groups ('rooms'). We did this one million times and asked "How often do simulation results look as extreme as the paper's?" The answer is "almost never":
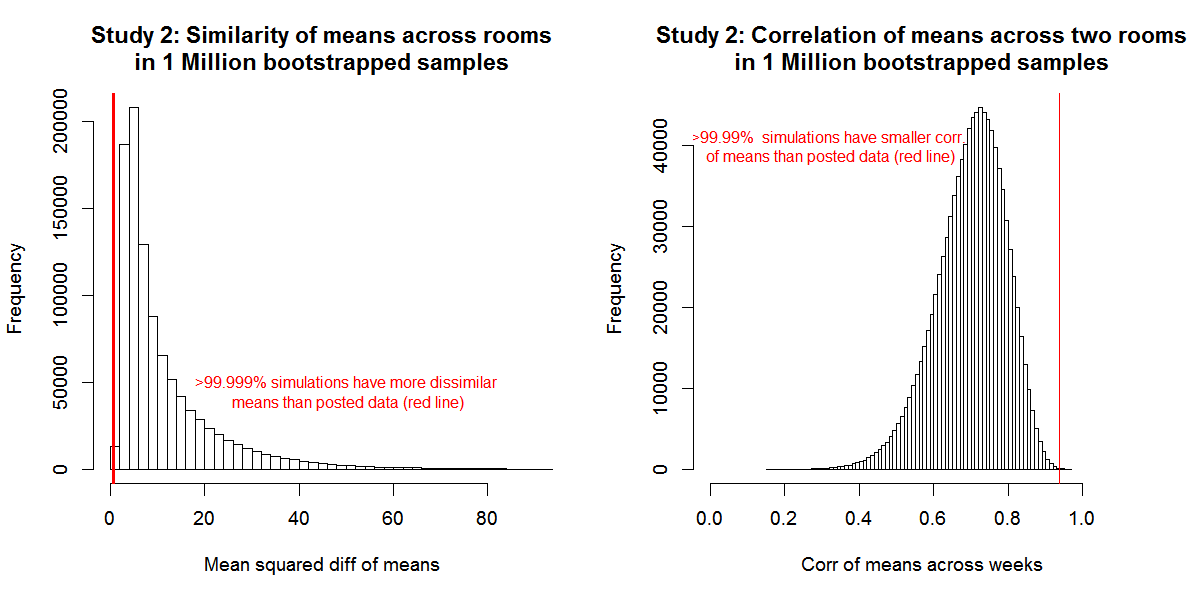
So, for example, the figure on the right shows that the correlation between means is on average about r=.7 rather than the r=.94 that's reported in the paper. Only 96 times in a million, would we expect it to be .94 or higher.
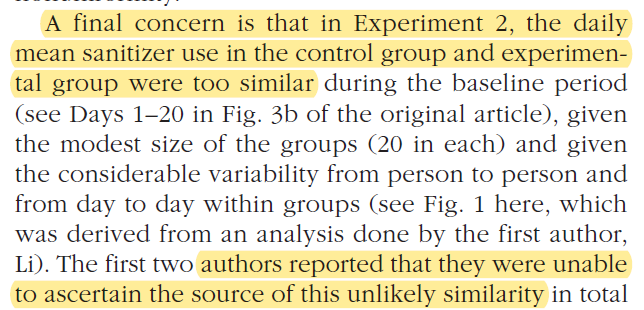
We don't think readers of the expression of concern would come away with sufficient information to appreciate the impossibility we shared with the authors and editor; all it says about it is:
Problem 5. Last digit… in Experiment 2
While less visually striking than for Experiments 1 and 3, the last digit is not distributed uniform in this experiment either, with N=1600, a scale precise to 1/100th of gram, rejects the uniform null with: χ2(9) = 43.45, p<.0001; see histogram .png [8].
Summary.
We appreciate that the authors acknowledge some of the problems we brought to their attention and further that they cannot assuage concerns because the data collection and management necessarily occurred at such a remove. On the other hand, as readers we are at a loss. Three experiments show unambiguous signs that there are problems with all of the reported data. How can we read the paper and interpret differences across conditions as meaningful while discounting the problems as otherwise meaningless? We think that it might be warranted to take the opposite view and see meaning in the long list of problems and therefore seeing the differences across conditions as meaningless.
We should maintain a very high burden of proof to conclude that any individual tampered with data.
But the burden of proof for dataset concerns should be considerably lower. We do not need to know the source of contamination in order to lose trust in the data.
Even after the correction, and the clarifications of the Expression of Concern, we still believe that these data do not deserve the trust of Psychological Science readers.
![]()
Author feedback
Our policy (.htm) is to share drafts of blog posts that discuss someone else’s work with them to solicit feedback. As mentioned above we contacted the authors and editor of Psych Science. They provided feedback on wording and asked that we wait while they revised the correction, which we did (for over 6 months).
Just before posting they gave us another round of suggestions and then Meng Li (htm) wrote a separate piece (.htm).
When all is said and done, the original authors have not yet provided benign mechanisms that could have generated the data they reported (neither the last digit pattern, nor the excessive similarity of means).
Footnotes.- It is also worth noting that this post is possible because the authors elected to post their data. [↩]
- Basic background for the intrigued: The original demonstration is Huber, Payne, and Puto (1982 .htm). Heath & Chaterjee (1995 .htm) provide a good review of several studies [↩]
- Study 2 used a soaking basin as a decoy instead [↩]
- Footnote 1 in the correction reads:
 [↩]
[↩] - About 80 years ago, Benford (.htm) noticed that with collections of numbers, the leading digit (the one furthest to the left) had a predictable pattern of occurrence: 1’s were more common than 2’s, which were more common than 3’s etc. A mathematical formula generalizing Benford's law applies to digits further to the right in a different way: as one moves right, to the 2nd, 3rd, 4th digit, etc., those numbers should be distributed closer and closer to uniformly (i.e., 1 is just as common as 2, 3, 4, etc.). Because those predictions are derived mathematically, and observed empirically, violations of Benford's law are a signal that something is wrong. Benford's law has, for first and last digits, been used to detect fraud in accounting, elections, and science. See Wikipedia. [↩]
- In this appendix (.pdf) we document that the uniform is indeed what you'd expect for these data, even though values on this variable have just 2 digits. [↩]
- As an extra precaution, we analyzed other datasets with grams as the dependent variable. We found studies on (i) soup consumption, (ii) brood carcass, (iii) American bullfrog size, and (iv) decomposing bags. Last digit was uniform across the board (See details: .pdf). [↩]
- This is perhaps a good place to tell you of an additional anecdotal problem: when preparing the first draft of this post, back in June, we noticed this odd row in Experiment 2. The 5 gram scale makes a surprising re-appearance on day 4, takes a break on day 9, but returns on day 10
 [↩]
[↩]

