It is a neat idea. Get a ton of papers. Extract all p-values. Examine the prevalence of p-hacking by assessing if there are too many p-values near p=.05. Economists have done it [SSRN], as have psychologists [.html], and biologists [.html]. These charts with distributions of p-values come from those papers:
The dotted circles highlight the excess of .05s, but most p-values are way smaller, suggesting p-hacking happens but is not a first order concern. That’s reassuring, but falsely reassuring [1],[2].
Bad Sampling.
The are several problems with looking at all p-values, here I focus on sampling [3].
If we want to know if researchers p-hack their results, we need to examine the p-values associated with their results, those they may want to p-hack in the first place. Samples, to be unbiased, must only include observations from the population of interest.
Most p-values reported in most papers are irrelevant for the strategic behavior of interest. Covariates, manipulation checks, main effects in studies testing interactions, etc. Including them we underestimate p-hacking and we overestimate the evidential value of data. Analyzing all p-values asks a different question, a less sensible one. Instead of “Do researchers p-hack what they study?” we ask “Do researchers p-hack everything?” [4].
A Demonstration.
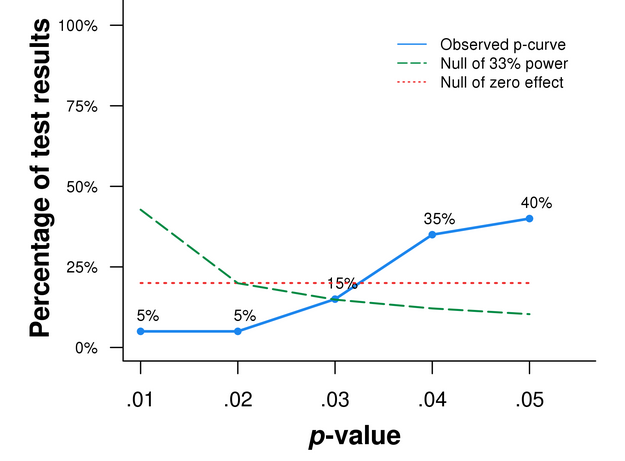
In our first p-curve paper (SSRN) we analyzed p-values from experiments with results reported only with a covariate.
We believed researchers would report the analysis without the covariate if it were significant, thus we believed those studies were p-hacked. The resulting p-curve was left-skewed, so we were right.
Figure 2. p-curve for relevant p-values in experiments reported only with a covariate.

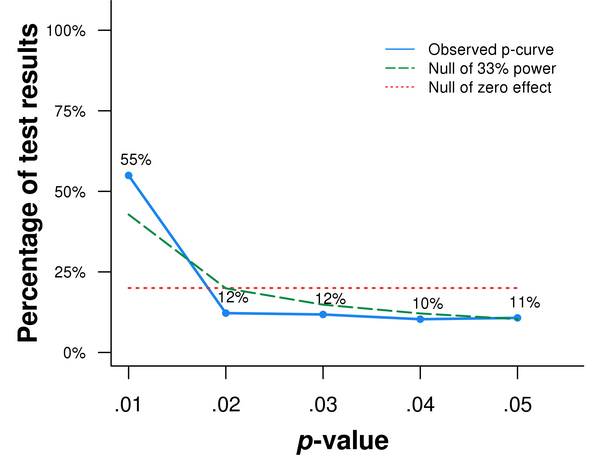
I went back to the papers we had analyzed and redid the analyses, only this time I did them incorrectly.
Instead of collecting only the (23) p-values one should select – we provide detailed directions for selecting p-values in our paper (SSRN) – I proceeded the way the indiscriminate analysts of p-values proceed. I got ALL (712) p-values reported in those papers.
Figure 3. p-curve for all p-values reported in papers behind Figure 2

Figure 3 tells that that the things those papers were not studying were super true.
Figure 2 tells the ones they were studying were not.
Looking at all p-values is falsely reassuring.
![]()
Author feedback
I sent a draft of this post to the first author of the three papers with charts reprinted in Figure 1 and the paper from footnote 1. They provided valuable feedback that improved the writing and led to footnotes 2 & 4.
Footnotes.
- The Econ and Psych papers were not meant to be reassuring, but they can be interpreted that way. For instance, a recent J of Econ Perspectives (.pdf) paper reads “Brodeur et al. do find excess bunching, [but] their results imply that it may not be quantitatively as severe as one might have thought” The PLOS Biology paper was meant to be reassuring. [
]
- The PLOS Biology paper had two parts. The first used the indiscriminate selection of p-values from articles in a broad range of journals and attempted to assess the prevalence and impact of p-hacking in the field as a whole. This part is fully invalidated by the problems described in this post. The second used p-values from a few published-metaanalyses on sexual selection in evolutionary biology; this second part is by construction not representative of biology as a whole. In the absence of a p-curve disclosure table, where we know which p-value was selected from each study, it is not possible to evaluate the validity of this exercise. [
]
- For other problems see Dorothy Bishop’s recent paper [.html] [
]
- Brodeur et al did painstaking work to exclude some irrelevant p-values, e.g., those explicitly described as control variables, but nevertheless left many in . To give a sense, they obtained an average of about 90 p-values from each paper. To give a concrete example, one of the papers in their sample is by Ferreira and Gyourko (.pdf). Via regression discontinuity it shows that a mayor's political party does not predict policy. To demonstrate the importance of their design, Ferreira & Gyourko also report naive OLS regressions with highly significant but spurious and incorrect results that at face value contradict the paper's thesis (see their Table II). These very small but irrelevant p-values were included in the sample by Brodeur et al. [
]

