The smaller your sample, the less likely your evidence is to reveal the truth. You might already know this, but most people don’t (.html), or at least they don’t appropriately apply it (.html). (See, for example, nearly every inference ever made by anyone). My experience trying to teach this concept suggests that it’s best understood using concrete examples.
So let’s consider this question: What if sports games were shorter?
Most NFL football games feature a matchup between one team that is expected to win – the favorite – and one that is not – the underdog. A full-length NFL game consists of four 15-minute quarters. [1] After four quarters, favorites outscore their underdog opponents about 63% of the time. [2] Now what would happen to the favorites’ chances of winning if the games were shortened to 1, 2, or 3 quarters?
In this post, I’ll tell you what happens and then I’ll tell you what people think happens.
What If Sports Games Were Shorter?
I analyzed 1,008 games across four NFL seasons (2009-2012; data .xls). Because smaller samples are less likely to reveal true differences between the teams, the favorites’ chances of winning (vs. losing or being tied) increase as game length increases. [3]
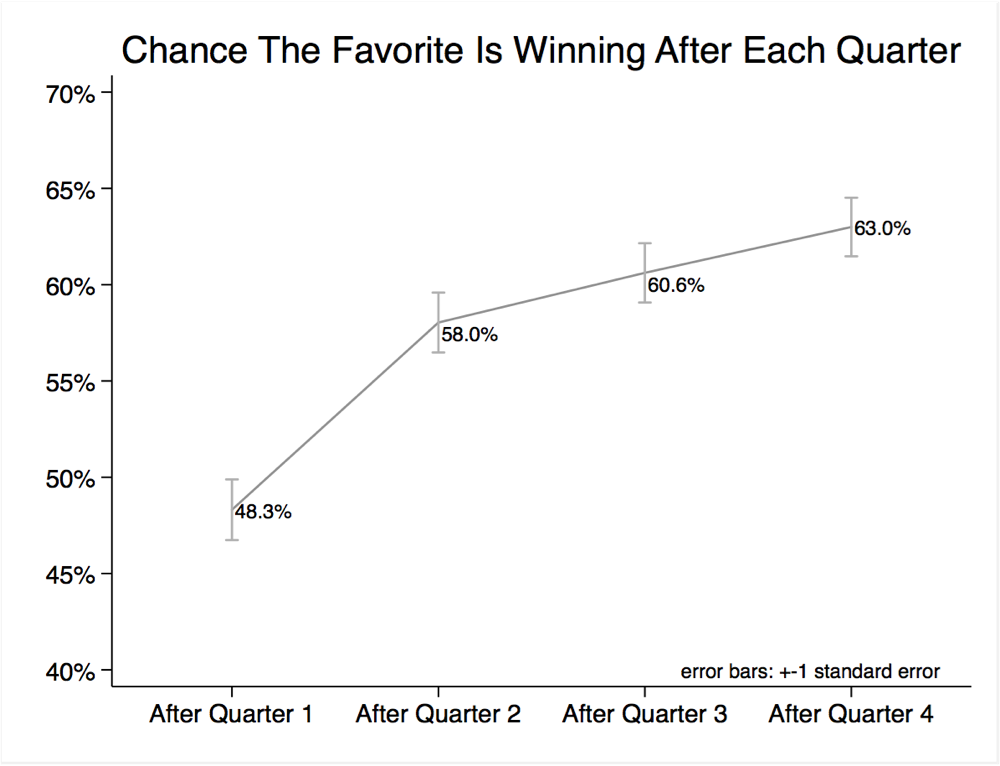
Reality is more likely to deviate from true expectations when samples are smaller. We can see this again in an analysis of point differences. For each NFL game, well-calibrated oddsmakers predict how many points the favorite will win by. Plotting these expected point differences against actual point differences reveals how the relationship between expectation and reality increases with game length:

Sample sizes affect the likelihood that reality will deviate from an average expectation.
But sample sizes do not affect what our average expectation should be. If a coin is known to turn up heads 60% of the time, then, regardless of whether the coin will be flipped 10 times or 100,000 times, our best guess is that heads will turn up 60% of time. The error around 60% will be greater for 10 flips than for 100,000 flips, but the average expectation will remain constant.
To see this in the football data, I computed point differences after each quarter, and then scaled them to a full-length game. For example, if the favorite was up by 3 points after one quarter, I scaled that to a 12-point advantage after 4 quarters. We can plot the difference between expected and actual point differences after each quarter.
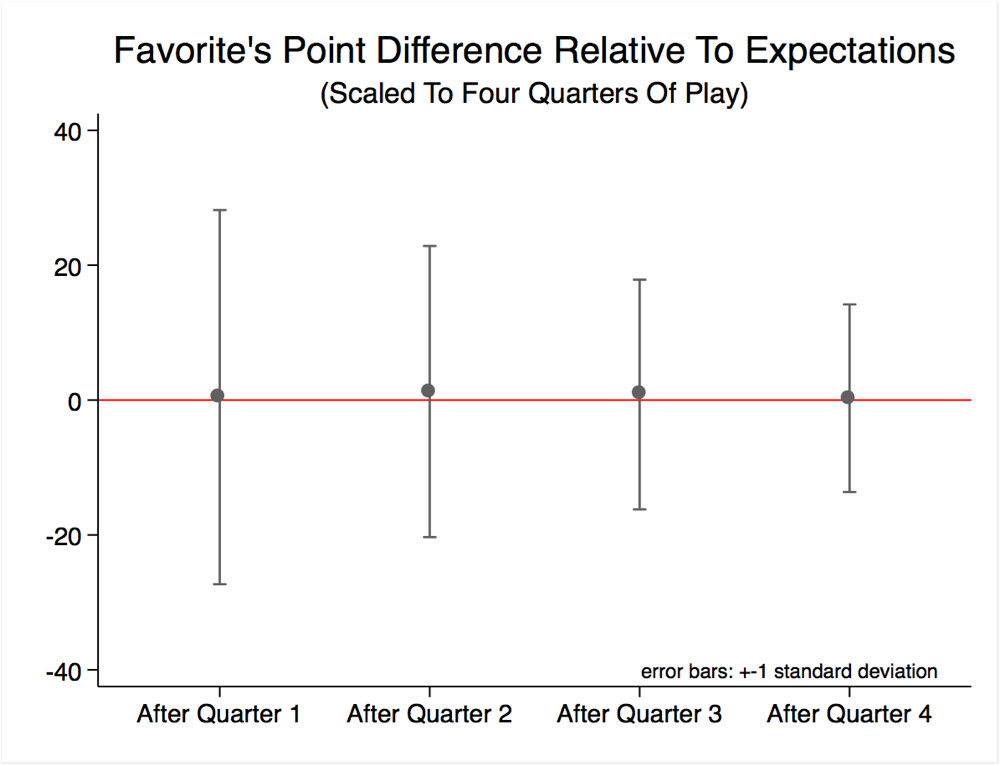
The dots are consistently near the red line on the above graph, indicating that the average outcome aligns with expectations regardless of game length. However, as the progressively decreasing error bars show, the deviation from expectation is greater for shorter games than for longer ones.
Do People Know This?
I asked MTurk NFL fans to consider an NFL game in which the favorite was expected to beat the underdog by 7 points in a full-length game. I elicited their beliefs about sample size in a few different ways (materials .pdf; data .xls).
Some were asked to give the probability that the better team would be winning, losing, or tied after 1, 2, 3, and 4 quarters. If you look at the average win probabilities, their judgments look smart.
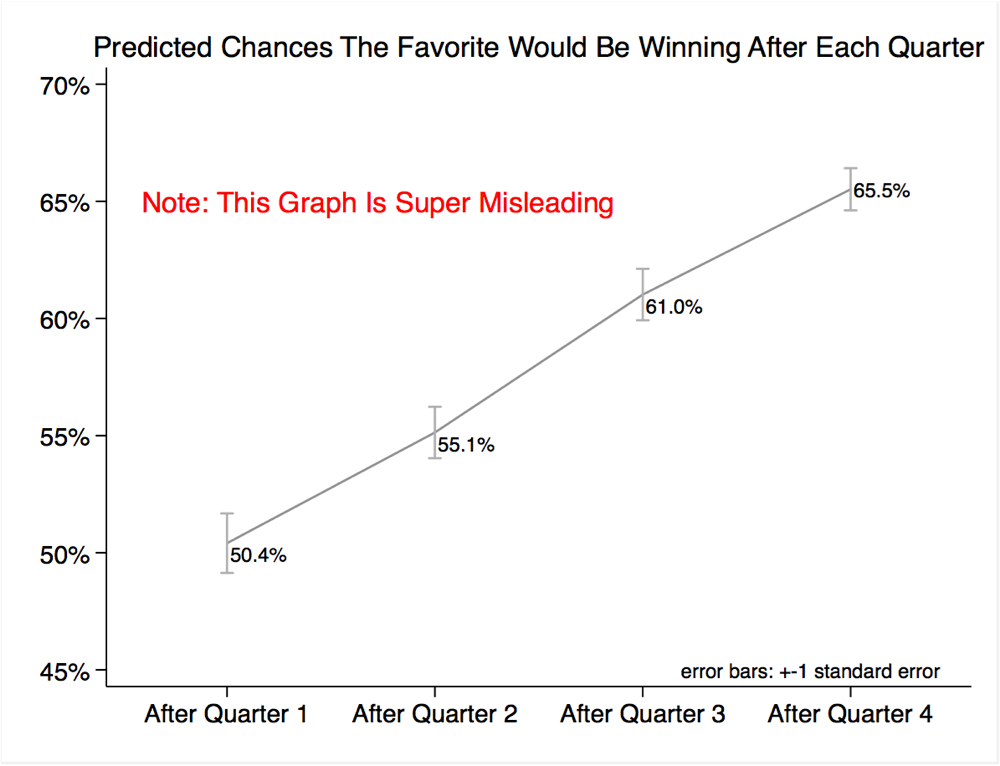
But this graph is super misleading, because the fact that the average prediction is wise masks the fact that the average person is not. Of the 204 participants sampled, only 26% assigned the favorite a higher probability to win at 4 quarters than at 3 quarters than at 2 quarters than at 1 quarter. About 42% erroneously said, at least once, that the favorite’s chances of winning would be greater for a shorter game than for a longer game.
How good people are at this depends on how you ask the question, but no matter how you ask it they are not very good.
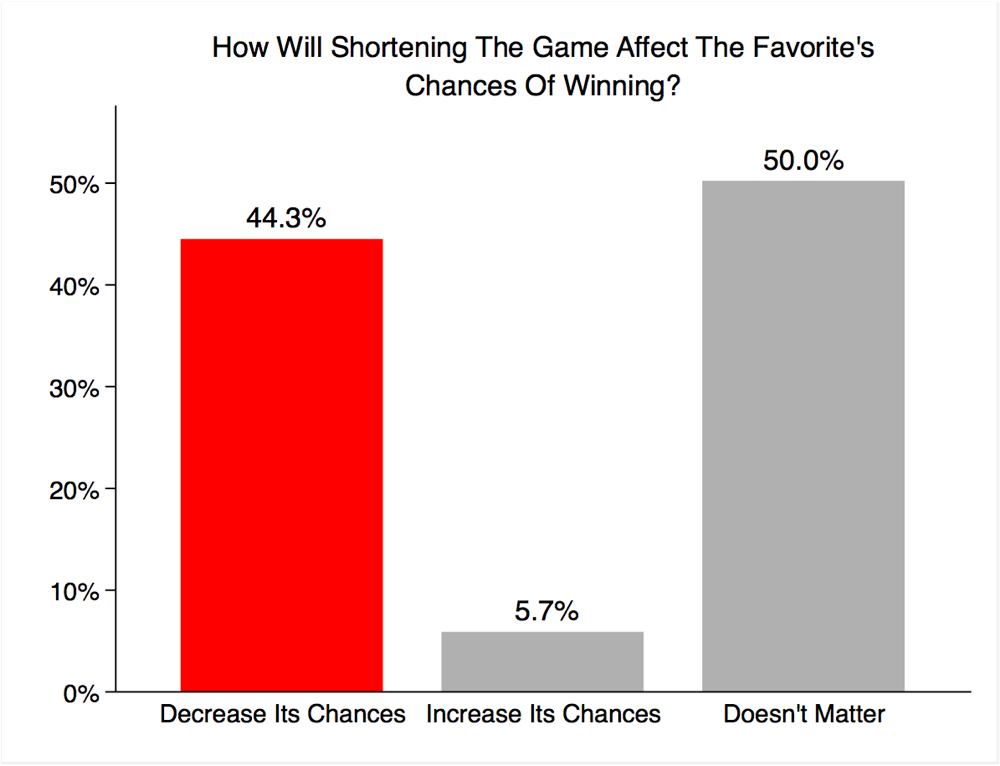
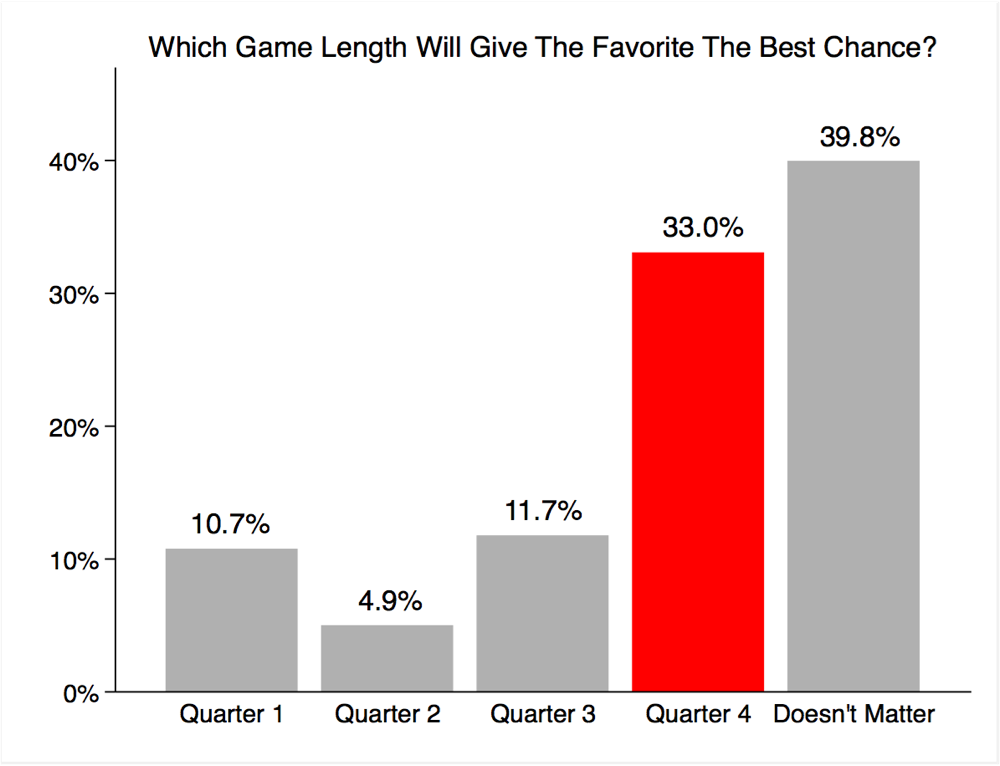
I asked 106 people to indicate whether shortening an NFL game from four quarters to two quarters would increase, decrease, or have no effect on the favorite’s chance of winning. And I asked 103 people to imagine NFL games that vary in length from 1 quarter to 4 quarters, and to indicate which length would give the favorite the best chance to win.
The modal participant believed that game length would not matter. Only 44% correctly said that shortening the game would reduce the favorite’s chances, and only 33% said that the favorite’s chances would be best after 4 quarters than after 3, 2, or 1.
Even though most people get this wrong there are ways to make the consequences of sample size more obvious. It is easy for students to realize that they have a better chance of beating LeBron James in basketball if the game ends after 1 point than after 10 points. They also know that an investment portfolio with one stock is riskier than one with ten stocks.
What they don’t easily see is that these specific examples reflect a general principle. Whether you want to know which candidate to hire, which investment to make, or which team to bet on, the smaller your sample, the less you know.
![]()
- If the game is tied, the teams play up to 15 additional minutes of overtime. [↩]
- 7% of games are tied after four quarters, and, in my sample, favorites won 57% of those in overtime; thus favorites win about 67% of games overall [↩]
- Note that it is not that the favorite is more likely to be losing after one quarter; it is likely more to be losing or tied. [↩]
