For a recent journal club in Barcelona, we read a just published article in the Journal of Experimental Psychology: General (JEP:G). The paper is on the impact of using gen-AI on creativity. The paper proposes an inverted U: people are most creative with moderate levels of AI use.
The paper has three studies. Studies 1 & 2 are experiments. This post is about Study 3, which is described as a “field study”. I will argue the U shape in that study is spurious.
As good a place as any to let you know we are now cross listing on Substack
Study 3.
Study 3 involves a two-wave survey run on CloudResearch (a pool of online participants). In the first wave, a sample of “creative workers” rate on 7-point scales how much they use AI for work. In the second stage, conducted a week later, each worker’s supervisor (!) evaluated the employee’s creativity with a nine-item scale.
In an analysis described as ‘pre-registered’ [1], the paper reports results for a quadratic regression where the dependent variable is the supervisor’s creativity rating and the key predictors are the employee self-reported AI usage, and its square term. Both are significant. The paper says this “indicated a nonsymmetrical inverted-U-shaped relationship” (p.9), then shows Figure 6.
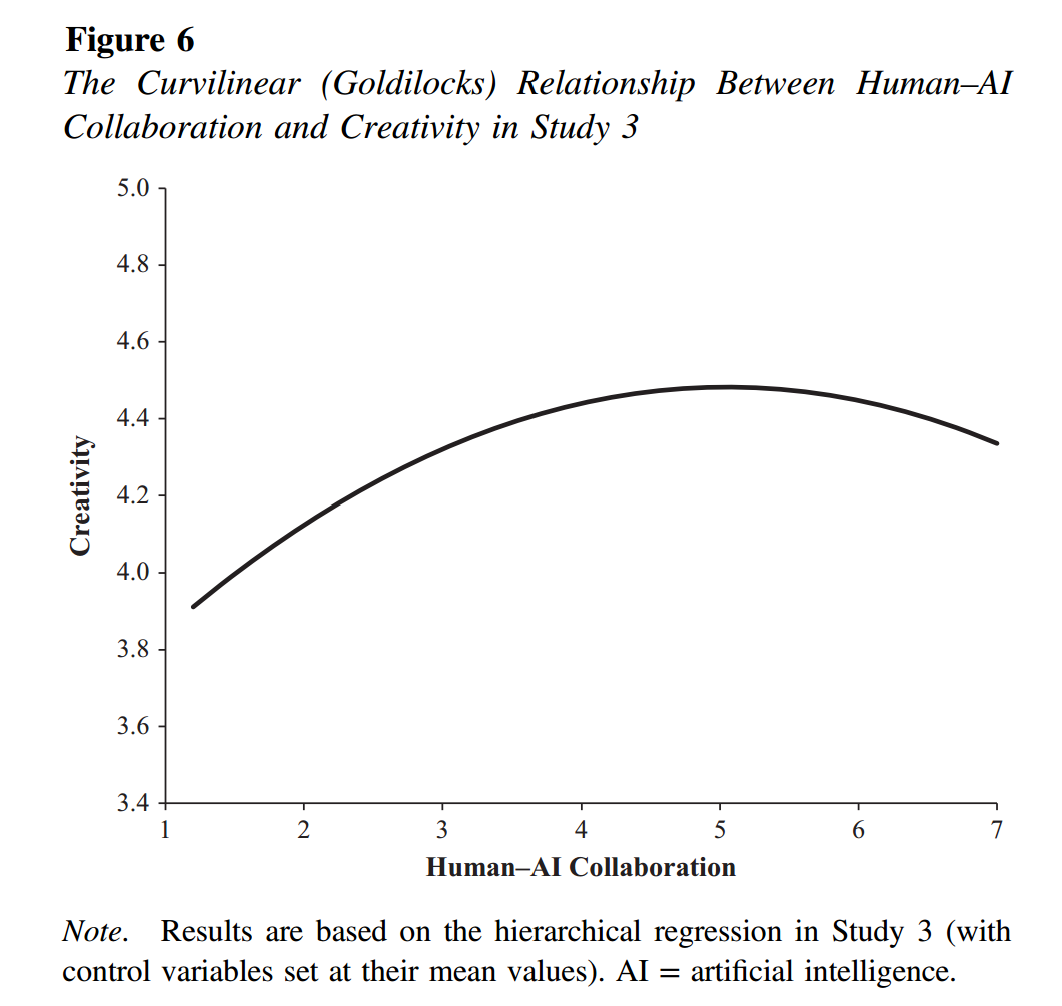
Fig 1. Reprint of Figure 6 in the JEP:G paper
The paper says the graph implies that “the maximum value of creativity reaching 4.5. After this point, creativity should decline.“
This inference, however, is not justified by the data.
At issue are two different types of error: sampling error and specification error.
Sampling error
Just because the quadratic term is significant, it does not follow that the U-shape is significant. The most succinct way to make this point is with a figure, I simply added the confidence band to Figure 6 (I analyzed the posted data to compute that band).

Fig 2. Adding confidence band
R Code & data to reproduce this and other figures: https://researchbox.org/5159
There is a LOT of uncertainty in the estimated function, and the possibility that the association is monotonic, that more AI use is associated with more creativity, for all levels of AI use, is very far from rejected with the data.
Specification Error
Figure 6 in the paper, and my airbrushed-in confidence band, assume that the true association between AI Involvement and Creativity is perfectly captured by a quadratic function. That is, it estimates a quadratic regression and takes the resulting estimates at face value.
In two blogposts and a published paper I have explained why this approach is invalid, and have proposed to instead test for U-shapes relying on a “two-lines” procedure.
1. Colada[27] Thirty-somethings are Shrinking and Other U-Shaped Challenges
2. Colada[62] Two-lines: The First Valid Test of U-Shaped Relationships
3. Simonsohn (2018). Two lines: A valid alternative to the invalid testing of U-shaped relationships with quadratic regressions. AMPPS, 1(4), 538-555
With that two-lines test, this U-shape is not significant (p = .81). See figure below, generated with the (open source) online app
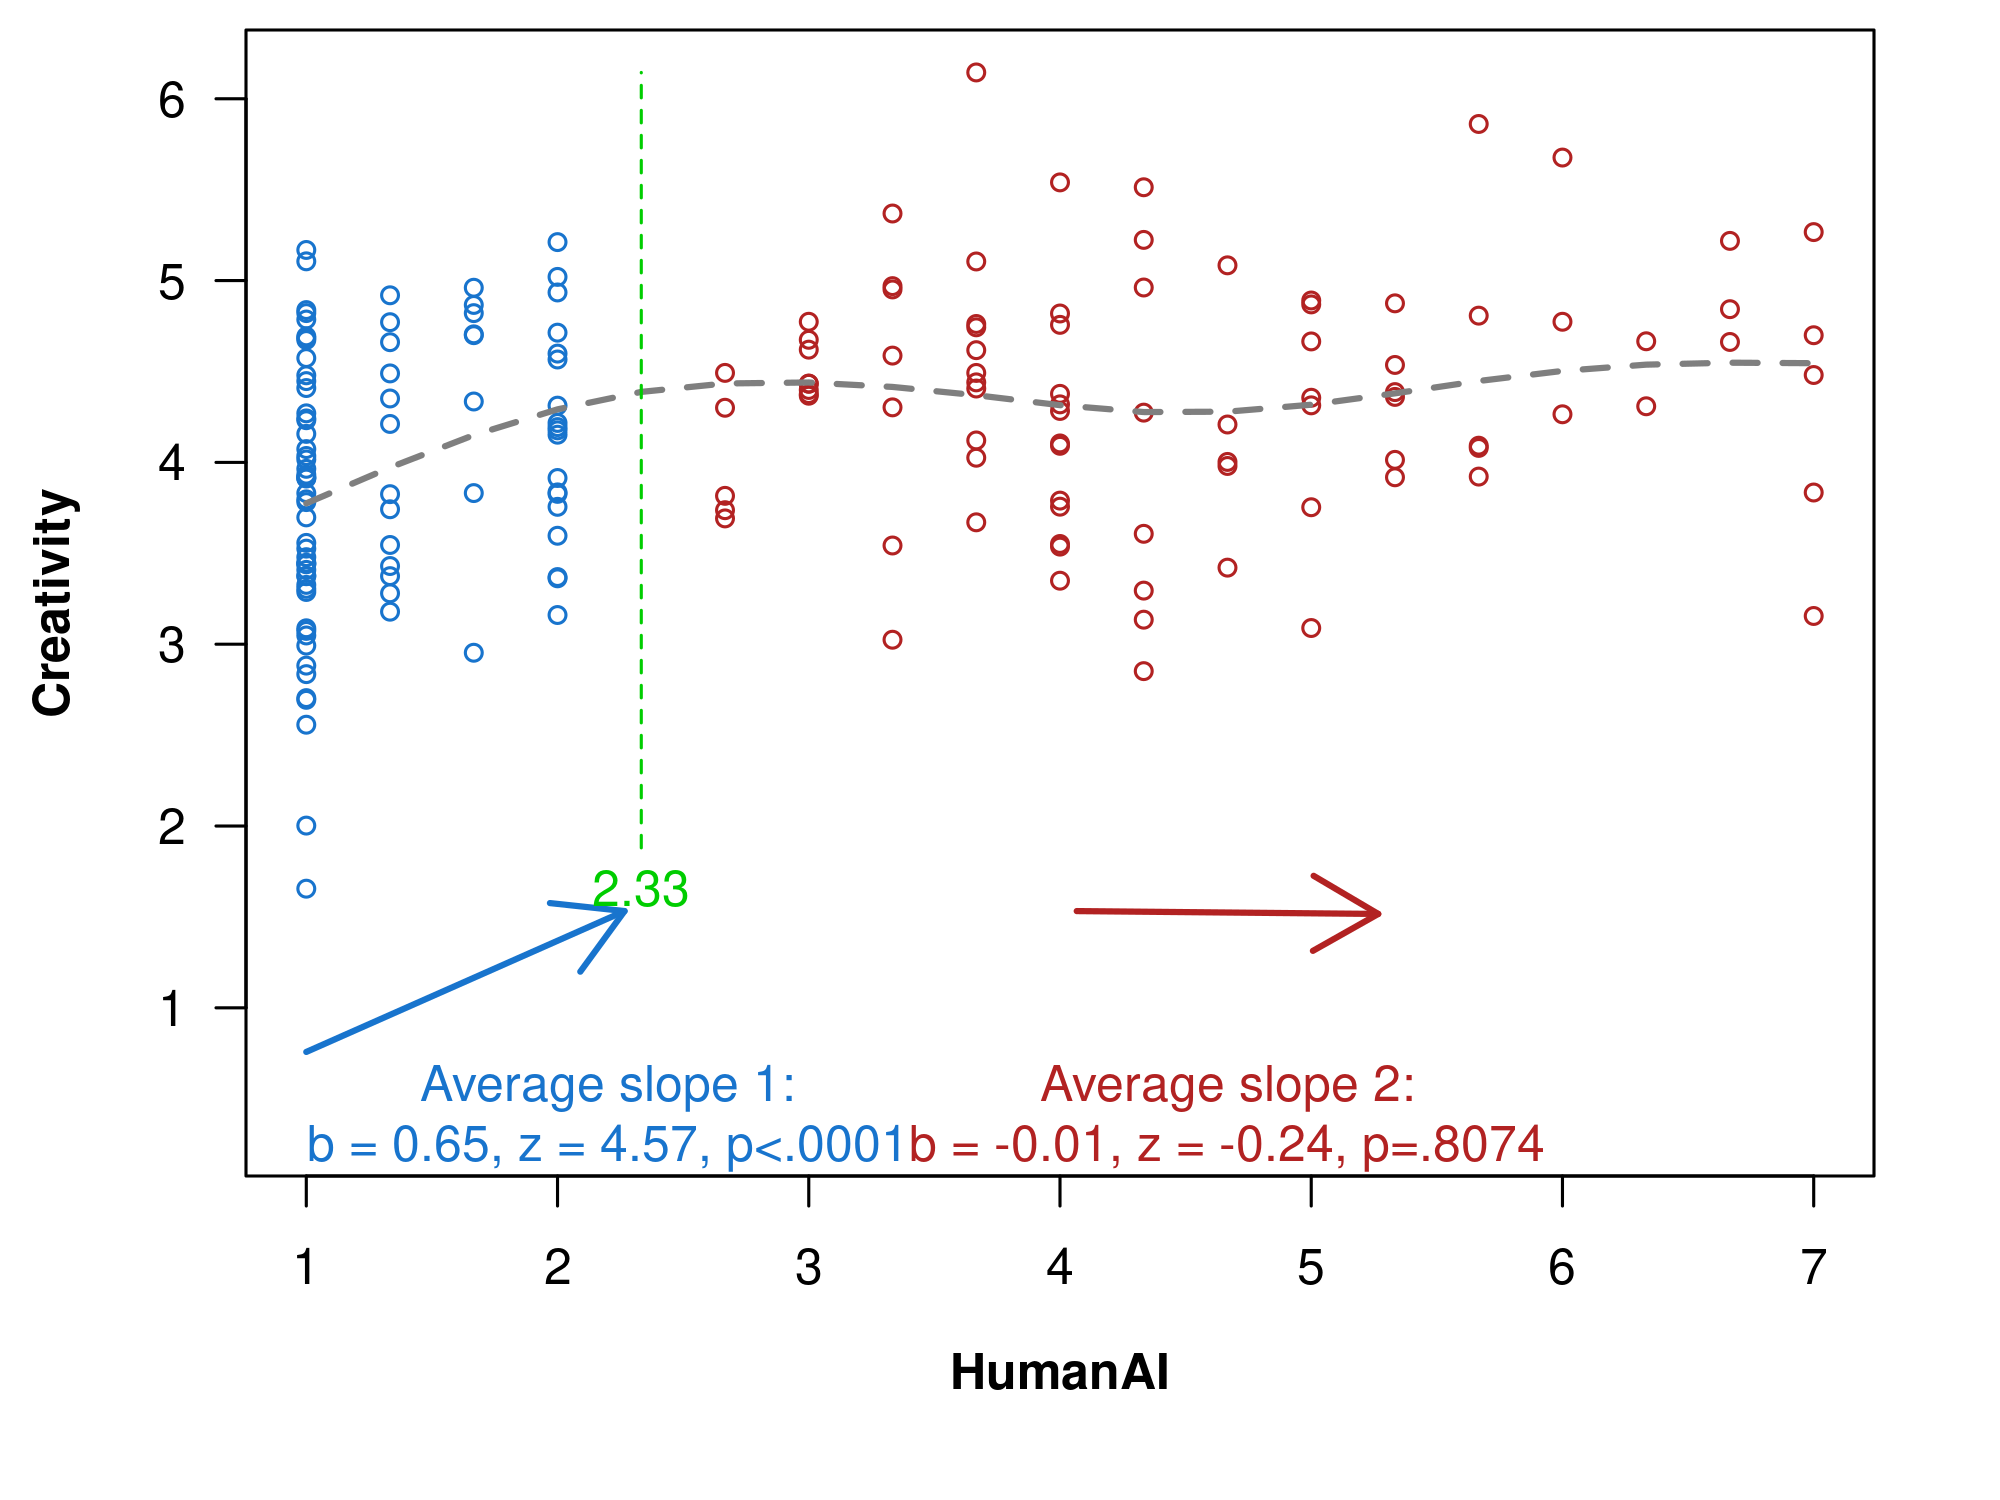
Fig. 3. Results from two-lines test.
(dashed curve is based on a GAM; breakpoint set with ‘Robin Hood’ procedure)
This call to use two-lines tests instead of quadratic regressions has been sufficiently successful; I will not rehash the two-lines arguments here [2].
I will instead give a new intuition for what the quadratic does wrong.
New intuition for problematic quadratic: effect here based on data over there
Let’s start where one should always start, plotting the distribution of the underlying data.

Fig 4. Distribution of key predictor
We see that 38% of the data has AI values between [1 & 2).
In contrast, less than 10% of the data is between [6 & 7].
This means that the (quadratic) regression, when fitting these data, will pay A LOT more attention to values [1 & 2), than [6 & 7]. OK. That’s intuitive enough. The next thing is less intuitive.
When the quadratic regression produces that inverted U, a negative slope for values [6 & 7], it is not because it is detecting a negative slope in that range, instead, it is because it is detecting a very positive slope in a different range, [1 & 2).
The regression is literally bending over backwards to fit a steep curve between 1&2 that then flattens out between 2 & 5. It is bending over in the range between [5 & 7], but only to accommodate the flattening of the curve at lower values.
More generally and precisely, the shape in any part of the curve need not be an adequate or interpretable summary of the local data.
A heartfelt statement by a quadratic regression
In an exclusive conversation with a quadratic regression, it shared with me this statement:
Statement by a Quadratic Regression
Look man, my job is to get close to the data overall. If you give me data where lots of observations have a steep slope, I cannot afford to not pay attention to that, so I do; I will give you a steep slope back, no problem. I can then even deliver a flattening of the curve for nearby data. But I cannot deliver a plateau, cannot deliver curves that stay flat. Eventually I must go negative as I get further from this flattening section; will I produce a U? Yes. Do I care? No. I am not paid to get shapes right. I am paid to get close to data. A spurious U will get a few datapoints wrong, but I am getting a lot more datapoints right in return, so I go for it, I cut my losses. The U is a ‘you problem’; I don’t see shapes. If you care about shapes, that’s a deal-breaker. I should see other people, and you should see other tools.
I will show two more figures just to provide some intuition for this point.
Without low values, no reversal for high values.
First, let’s rerun the quadratic regression in the paper, but excluding those observations with low values, between [1 & 2). If the spurious U-Shape is caused by them, we may expect the U-shape to go away, and it does. This highlights that when the quadratic reports a negative slope between 5 & 7 it is not doing that based on data between 5 & 7, that data is still there, it is doing it based on data between 1 and 2.

Fig 5. Fitted values and confidence band from quadratic regression on observed data, dropping steep section
Producing a U-shape ‘there’ by changing data ‘here’
For a final figure I took the real AI values but I produced a fake dependent variable, so that I would have control over the true functional form. I generated three functions. All three are monotonic, more AI always produces more creativity, but I varied how disproportionately steep was the function between [1 & 2]. Going from steep, to steeper, to steepest.
The steepest function in the range between [1 &2] produces a spurious U-shape for high-AI values.
The merely steep function does not.

Fig 6. The negative slope in the quadratic can result from a steep positive slope far away in the data
R Code & data to reproduce this and other figures: https://researchbox.org/5159
Feedback policy
Our policy is to contact authors whose work we cover to receive feedback before posting. I first contacted the author a bit over two weeks ago. We had a cordial and constructive exchange, where he clarified some of the details I thought peer-reviewers at JEP:G should have made sure were included in the paper (namely, how the sample was constructed and what the response rates were). The author provided feedback on wording that I tried to incorporate. He noted that his analysis, a quadratic regression to test for U-shapes, is mainstream in his field and mentioned a 2013 paper by an influential researcher, published in Psych Science, that he had used as a benchmark (htm).
![]()
Footnotes.
- Pre-registration
The analysis in the pre-registration (https://aspredicted.org/DC2_WKN ) does not indicate which covariates will be included in the regression. It also doesn’t specify how the quadratic regression will be interpreted. It reads: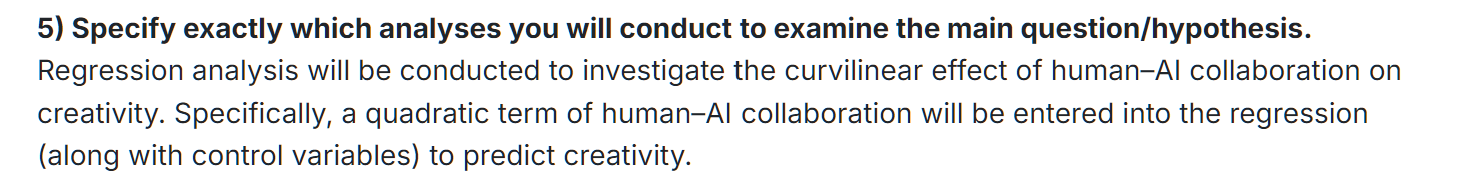
The paper does report results for alternative specifications in the supplement, and the main text notes that the quadratic effect of AI is not significant when all covariates are excluded (p = .14, page 3302). There is also something a bit odd with sample size. The sample size reported in the paper, N=188 pairs, is larger than that in the AsPredicted pre-registration (N=150), but the paper apologizes for it being too small.

Neither expected nor observed return/completion rates are reported. I asked the author about them who indicated that 250 workers provided information, and he later obtained responses from 188 supervisors “who could be matched to those workers”. He also explained that “although the sample size reached the pre-registered target for practical considerations, it still did not reach the larger target specified by the power analysis requested during the review process”.
[↩]
- On two-lines being sufficiently successful
My casual observations is that most papers in top-psych journals use the two-lines test when testing U-shapes. They do continue also reporting quadratic results for the most part and use two-lines as a robustness check. But I have not done a systematic lit review to verify this casual observation.[↩]