A forthcoming article in the Journal of Personality and Social Psychology has made an effort to characterize changes in the behavior of social and personality researchers over the last decade (.htm). In this post, we refer to it as “the JPSP article” and to the authors as "the JPSP authors." The research team, led by Matt Motyl, uses two strategies. In the first, they simply ask a bunch of researchers how they have changed. Fewer dropped dependent variables? More preregistration? The survey is interesting and worth a serious look.
The other strategy they employ is an audit of published research from leading journals in 2003/2004 and again from 2013/2014. The authors select a set of studies and analyze them with a variety of contemporary metrics designed to assess underlying evidence. One of those metrics is p-curve, a tool the three of us developed together (see p-curve.com) [1]. In a nutshell, p-curve analysis uses the distribution of significant p-values testing the hypotheses of interest in a set of studies to assess the evidential value of the set [2]. We were very interested to see how the JPSP authors had used it.
In any given paper, selecting the test that’s relevant for the hypothesis of interest can be difficult for two reasons. First, sometimes papers simply do not report it [3]. Second, and more commonly, when relevant tests are reported, they are surrounded by lots of other results: e.g., manipulation checks, covariates, and omnibus tests. Because these analyses do not involve the hypothesis of interest, their results are not relevant for evaluating the evidential value of the hypothesis of interest. But p-curvers often erroneously select them anyway. To arrive at relevant inferences about something, you have to measure that something, and not measure something else.
As we show below, the JPSP authors too often measured something else. Their results are not diagnostic of the evidential value of the surveyed papers. Selecting irrelevant tests invalidates not only conclusions from p-curve analysis, but from any analysis.
Selecting the right tests
When we first developed p-curve analysis we had some inkling that this would be a serious issue, and so we talked about p-value selection extensively in our paper (see Figure 5, SSRN), user guide (.pdf), and online app instructions (.htm). Unfortunately, authors, and reviewers, are insufficiently attentive to these decisions.
When we review papers using p-curve, about 95% of our review time is spent considering how the p-values were selected. The JPSP authors included 1,800 p-values in their paper, an extraordinary number that we cannot thoroughly review. But an evaluation of even a small number of them makes clear that the results reported in the paper are erroneous. To arrive at a diagnostic result, one would need to go back and verify or correct all 1,800 p-values. One would need to start from scratch.
The JPSP authors posted all the tests they selected (.csv). We first looked at the selection decisions they had rated as “very easy.” The first decision we checked was wrong. So was the second. Also the third. And the 4th, the 5th, the 6th, the 7th and the 8th. The ninth was correct.
To convey the intuition for the kinds of selection errors in the JPSP article, and to hopefully prevent other research teams from committing the same mistakes, we will share a few notable examples, categorized by the type of error. This is not an exhaustive list.
Error 1. Selecting the manipulation check
Experimenters often check to make sure that they got the manipulation right before testing its effect on the critical dependent variable. Manipulation checks are not informative about the hypothesis of interest and should not be selected. This is not controversial. For example, the authors of the JPSP article instructed their coders that “manipulation checks should not be counted.” (.pdf)
Unfortunately, the coders did not follow these instructions.
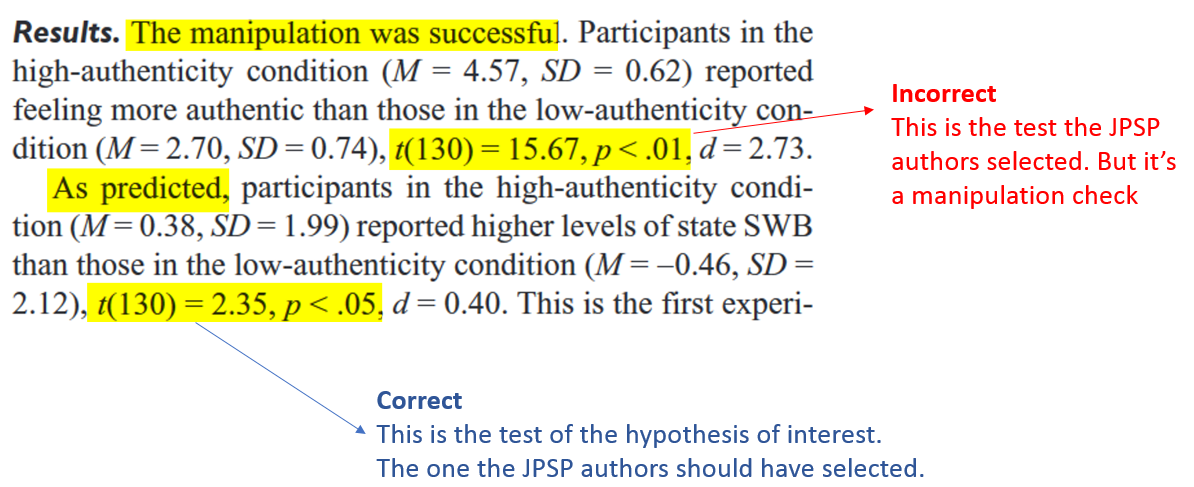
For example, from an original article that manipulated authenticity to find out if it influences subjective well-being, the authors of the JPSP article selected the manipulation check instead of the effect on well being.
Whereas the key test has a familiar p-value of .02, the manipulation check has a supernatural p-value of 10-32. P-curve sees those rather differently.
Error 2. Selecting an omnibus test.
Omnibus tests look at multiple means at once and ask “are any of these means different from any of the other means?” Psychological researchers almost never ask questions like that. Thus omnibus tests are almost never the right test to select in psychological research. The authors of the JPSP article selected about 200 of them.
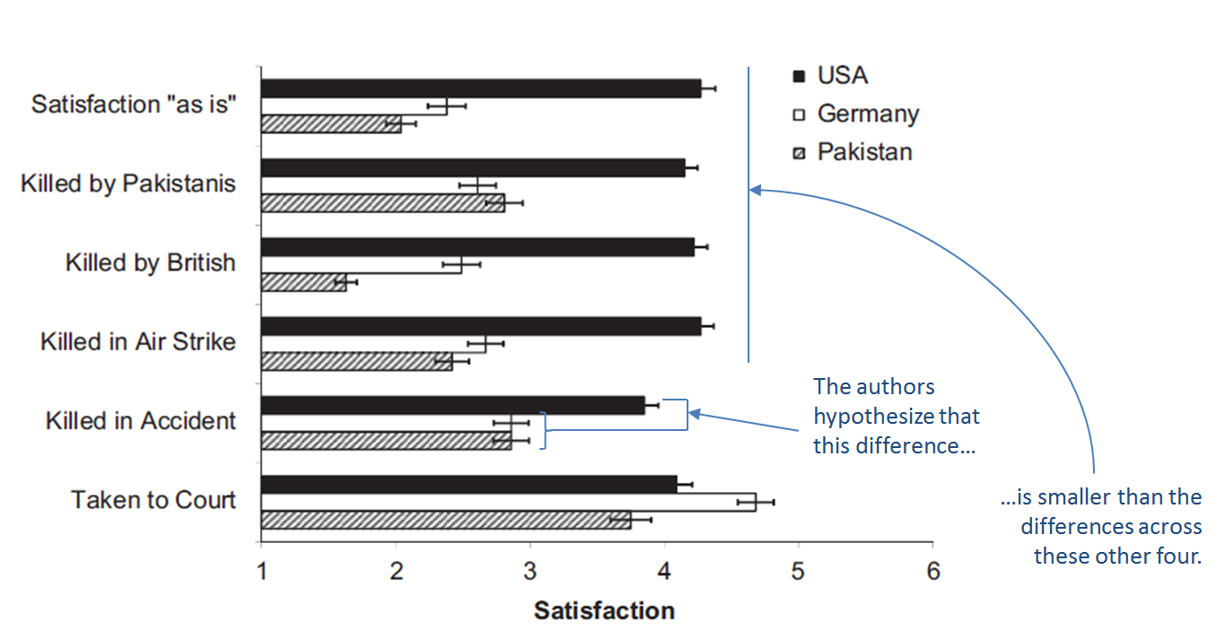
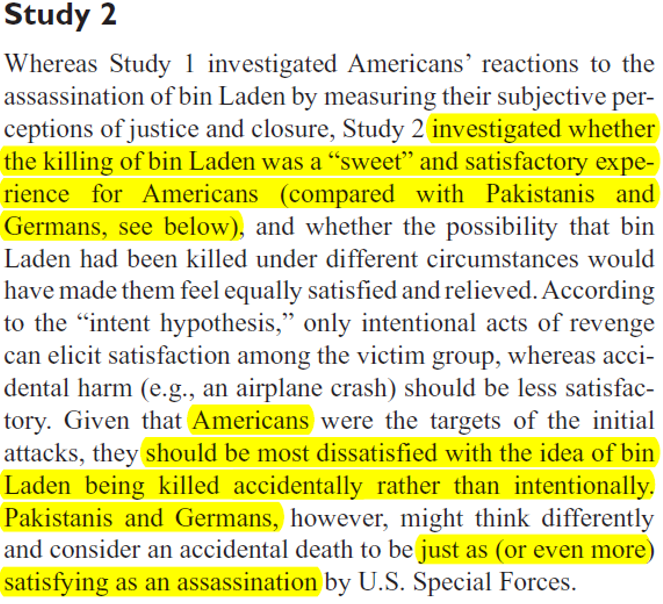
Here is one example. An original article examined satisfaction with bin Laden’s death. In particular, it tested whether Americans (vs. non-Americans), would more strongly prefer that bin Laden be killed intentionally rather than accidentally [4].
This is a textbook attenuated interaction prediction: the effect is bigger here than over there. Which interaction to select is nevertheless ambiguous: Should we collapse Germans and Pakistanis into one non-American bin? Should we include “taken to court”? Should we collapse across all forms of killings or do a separate analysis for each type? Etc. The original authors, therefore, had a large menu of potentially valid analyses to choose from, and thus so did the JPSP authors. But they chose an invalid one instead. They selected the F(10,2790)=31.41 omnibus test:

The omnibus test they selected does not test the interaction of interest. It is irrelevant for the original paper, and so it is irrelevant to use to judge the evidential value of that paper. If the original authors were wrong (so Americans and non-Americans actually felt the same way about accidental vs intentional bin Laden's death), the omnibus test would still be significant if Pakistanis were particularly dissatisfied with the British killing bin Laden, or if the smallest American vs non-American difference was for “killed in airstrike” and the largest for “killed by British”. And so on [5].
Update 2017 12 01. We were contacted by the authors of this original article concerned that readers of this post may incorrectly conclude they themselves interpreted the omnibus test as directly testing their hypothesis of interest. They did not, they only included the omnibus test in their paper because it is standard practice to also report it. They followed it up with planned contrasts that more directly test their hypothesis.
Error 3. Selecting the non-focal test
Often researchers interested in interactions first report a simple effect, but only the interaction tests the hypothesis of interest. First the set-up:

So there are two groups of people and for each the researchers measure pro-white bias. The comparison of the two groups is central. But, since that comparison is not the only one reported, there is room for p-curver error. The results:
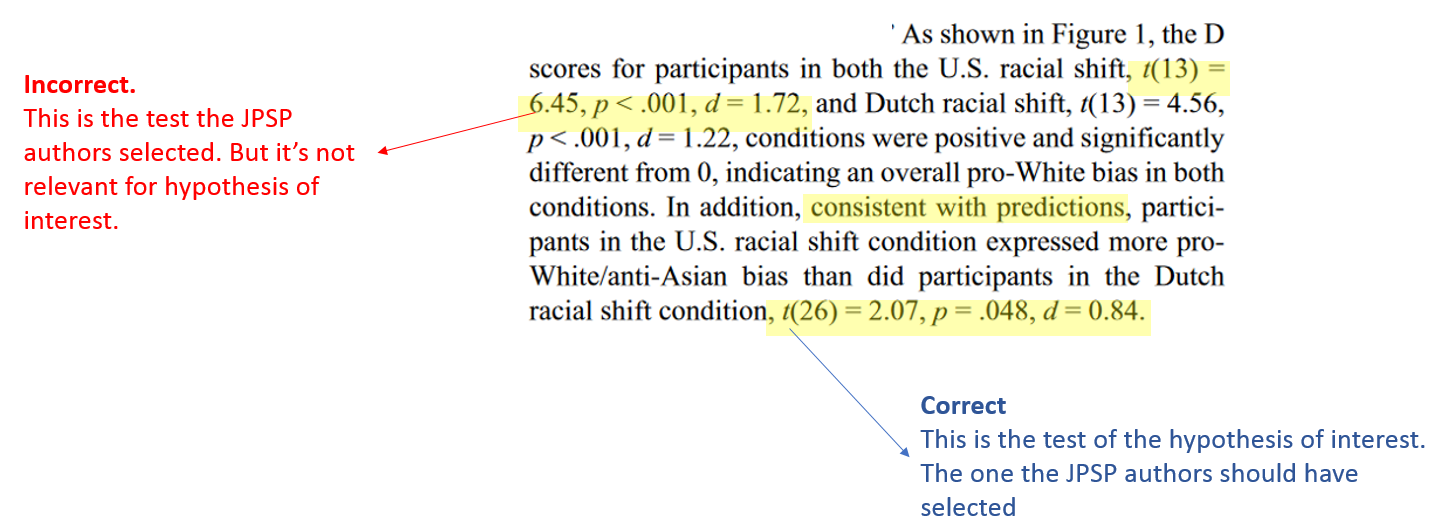
Three p-values. One shows the presence of a pro-white bias in the control condition, the next shows the presence of a pro-white bias in the experimental condition, and the third compares the experimental condition to the control condition. The third one is clearly the critical test for the researchers, but the JPSP authors pulled the first one. Again, the difference is meaningful: p = .048 vs. p = .00001.
Note: we found many additional striking and consequential errors. Describing them in easy-to-understand ways is time consuming (about 15 minutes each) but we prepared three more in a powerpoint (.pptx)
Conclusion
On the one hand, it is clear that the JPSP authors took this task very seriously. On the other hand, it is just as clear that they made many meaningful errors, and that the review process fell short of what we should expect from JPSP.
The JPSP authors draw conclusions about the status of social psychological and personality research. We are in no position to say whether their conclusions are right or wrong. But neither are they.
![]()
Author feedback.
We shared a draft of this post on May 3rd with Matt Motyl (.htm) and Linda Skitka (.htm); we exchanged several emails, but -despite asking several times- did not receive any feedback on the post. They did draft a response, but they declined to share it with us before posting it, and chose not to post it here.
Also, just before emailing Matt about our post last week, he coincidentally emailed us. He indicated that various people had identified (different) errors in their use of p-curve analysis in their paper and asked us to help correct them. Since Matt indicated being interested in fixing such errors before the paper is officially published in JPSP, we do not discuss them here (but may do so in a future post).
Footnotes.- Furthermore, and for full disclosure, Leif is part of a project that has similar goals (https://osf.io/ngdka/). [↩]
- Or, if you prefer a slightly larger nutshell: P-curve is a tool which looks at the distribution of critical and significant p-values and makes an assessment of underlying evidential value. With a true null hypothesis, p-values will be distributed uniformly between 0 and .05. When the null is false (i.e., an alternative is true) then p-values will be distributed with right-skew (i.e., more 0<p<.01 than .01<p<.02 etc.). P-curve analysis involves examining the skewness of a distribution of observed p-values in order to draw inferences about the underlying evidential value: more right skewed means more evidential value; and evidential value, in turn, implies the expectation that direct replications would succeed. [↩]
- For example, papers often make predictions about interactions but never actually test the interaction. Nieuwenhuis et al find that of 157 papers they looked at testing interactions, only half(!) reported an interaction .htm [↩]
- Here is the relevant passage from the original paper, it involves two hypothesis, the second is emphasized more and mentioned in the abstract, so we focus on it here:
 [↩]
[↩] -
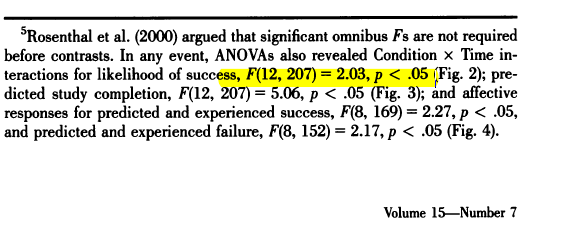
A second example of choosing the omnibus test is worth a mention, if only in a footnote. It comes from a paper by alleged fabricateur Larry Sanna. Here is a print-screen of footnote 5 in that paper. The highlighted omnibus text is the only result selected from this study. The original authors here are very clearly stating that this is not their hypothesis of interest:
[↩]

