This is really just a post-script to Colada [2], where I described a final exam question I gave in my MBA marketing research class. Students got a year’s worth of iTunes listening data for one person –me– and were asked: “What songs would this person put on his end-of-year Top 40?” I compared that list to the actual top-40 list. Some students did great, but many made the rookie mistake of failing to account for the fact that older songs (e.g., those released in January) had more opportunity to be listened to than did newer songs (e.g., those released in November).
I was reminded of this when I recently received an email from Spotify (my chosen music provider) that read:
First, Spotify, rather famously, does not make listening-data particularly public, [1] so any acknowledgement that they are assessing my behavior is kind of exciting. Second, that song, Inauguration [Spotify link], is really good. On the other hand, despite my respect for the hard working transistors inside the Spotify preference-detection machine, that song is not my “top song” of 2014. [2]
The thing is, “Inauguration” came out in January. Could Spotify be making the same rookie mistake as some of my MBA students?
Following Spotify’s suggestion, I decided to check out the rest of their assessment of my 2014 musical preferences. Spotify offered a ranked listing of my Top 100 songs from 2014. Basically, without even being asked, Spotify said “hey, I will take that final exam of yours.” So without even being asked I said, “hey, I will grade that answer of yours.” How did Spotify do?
Poorly. Spotify thinks I really like music from January and February.
Here is their data:
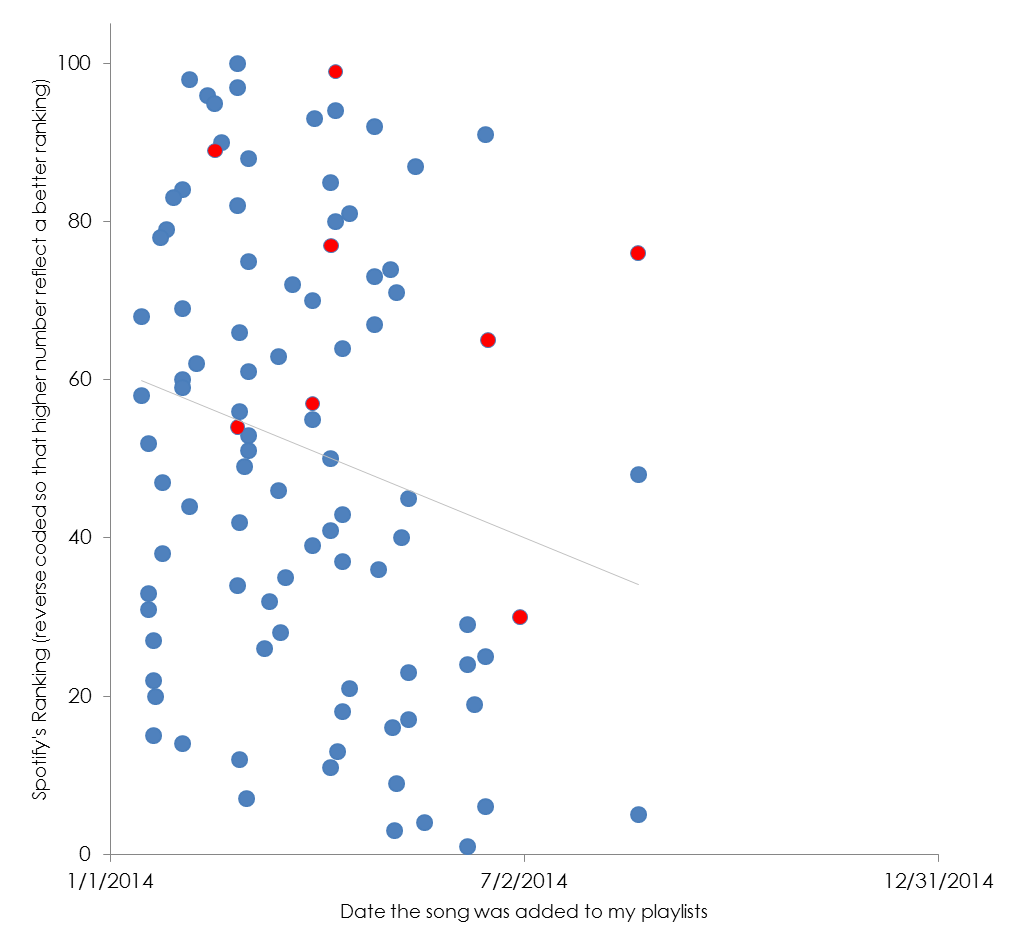
Each circle is a song; the red ones are those which I included in my actual Top 40 list.
If I were grading this student, I would definitely have some positive things to say. “Dear Spotify Preference-Detection Algorithm, Nice job identifying eight of my 40 favorite songs. In particular, the song that you have ranked second overall, is indeed in my top three.” On the other hand, I would also probably say something like, “That means that your 100 guesses still missed 32 of my favorites. Your top 40 only included five of mine. If you’re wondering where those other songs are hiding, I refer you to the entirely empty right half of the above chart. Of your Top 100, a full 97 were songs added before July 1. I like the second half of the year just as much as the first.” Which is merely to say that the Spotify algorithm has room for improvement. Hey, who doesn’t?
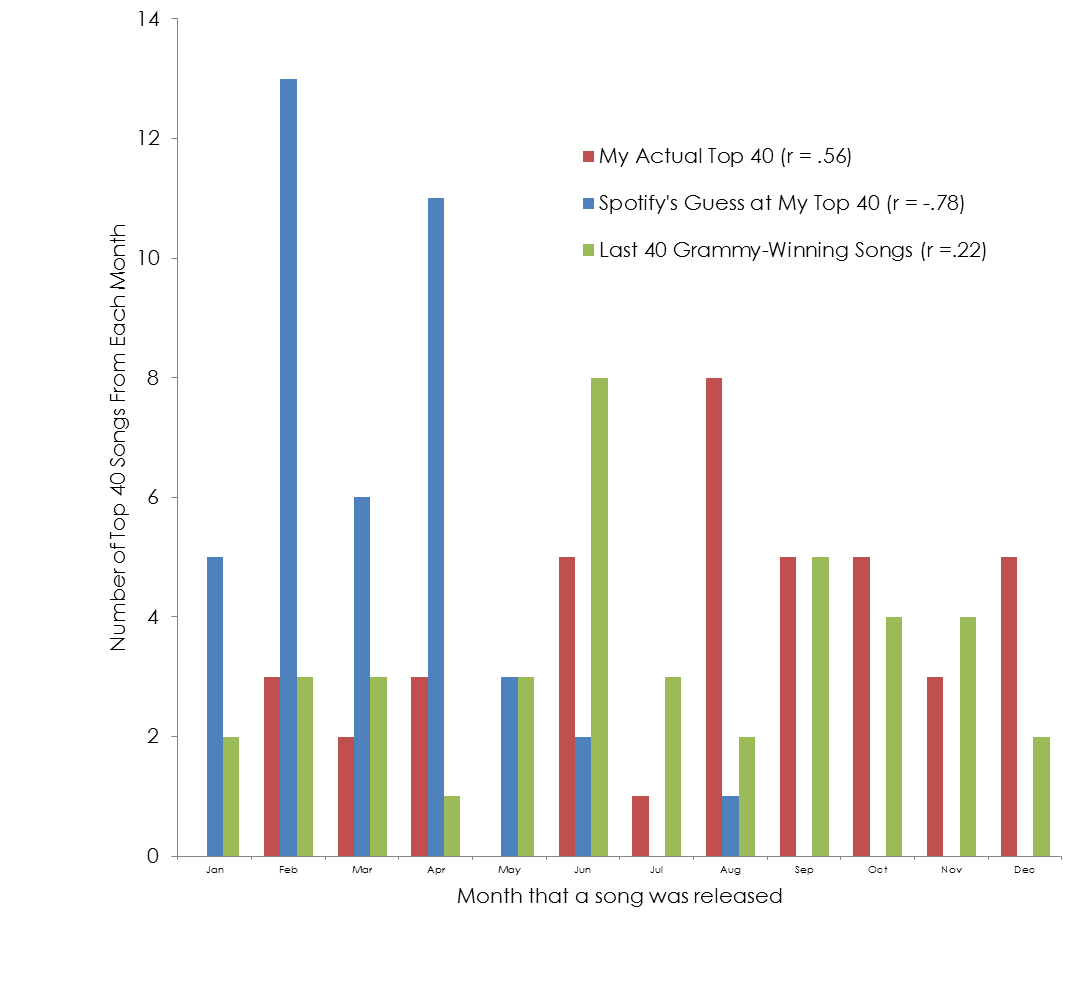
Actually, in preparing this post, I was surprised to learn that, if anything, I have a strong bias toward songs released later in the year. This bias that could reflect my tastes, or alternatively a bias in the industry (see this post in a music blog on the topic, .html). I looked at when Grammy-winning songs are released and learned that they are slightly biased toward the second half of the year [3]. The figure below shows the distributions (with the correlation between month and count).
I have now learned how to link my Spotify listening behavior to Last.fm. A year from now perhaps I will get emails from two different music-distribution computers and I can compare them head-to-head? In the meantime, I will probably just listen to the forty best songs of 2014 [link to my Spotify playlist].
![]()
- OK, “famously” is overstated, but even a casual search will reveal that there are many users who want more of their own listening data. Also, “not particularly public” is not the same as “not at all public.” For example, they apparently share all kinds of data with Walt Hickey at FiveThirtyEight (.html). I am envious of Mr. Hickey.[↩]
- My top song of 2014 is one of these (I don’t rank my Top 40): The Black and White Years – Embraces, Modern Mod – January, or Perfume Genius – Queen[↩]
- I also learned that “Little Green Apples” won in the same year that “Mrs. Robinson” and “Hey Jude” were nominated. Grammy voters apparently fail a more basic music preference test.[↩]