In Colada[124] I summarized a co-authored critique (with Banki, Walatka and Wu) of a recent AER paper that proposed risk preferences reflect ‘complexity’ rather than preferences a-la Prospect Theory. Ryan Oprea, the AER author, has written a rejoinder (.pdf). Its first main point (pages 5-12), is that our results with medians are ‘knife edge’ (p.8), by which he means two things: medians are unstable and unrepresentative.
- Unstable: “a small change … would disrupt the finding” (p.8)
- Unrepresentative: medians do a “poor job representing overall systematic tendencies” (p.9).
This post explains why I think his data do not support either thing.
I hope it’s interesting even if you aren’t into debating lotteries, ‘complexity’, or prospect theory.
“Knife Edge” Claim 1: medians are unstable
Figure 1 in Colada[124] and our commentary depicts medians, this is its key panel:

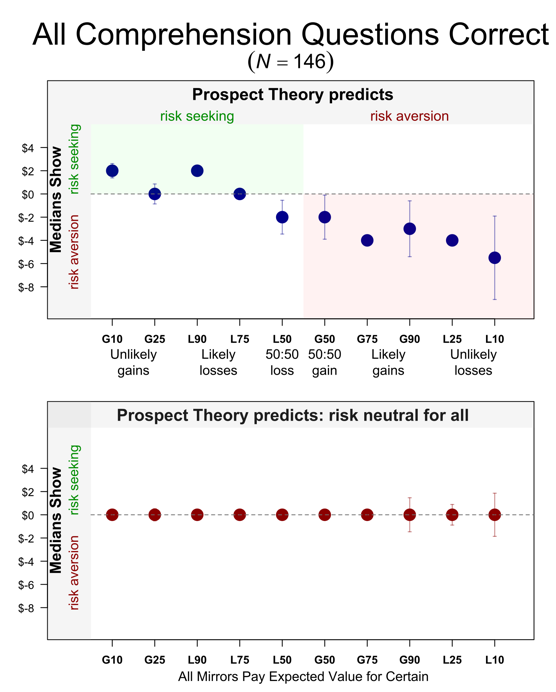
Fig 1. Results with medians being critiqued as ‘Knife Edge’.
The median participant valued lotteries largely as predicted by prospect theory, and mirrors at expected value. In our view, this contradicts the ‘complexity’ critique of prospect theory inviting a closer look at the data, which the remaining 8 figures in the paper provide.
Ryan argued the median is an unstable estimate relying on a CDF. I will get to that CDF in a second, but. First. Pay attention to the error bars in the figure above, they depict two (bootstrapped) standard errors on either direction. Notice that most mirrors don’t have error bars. It’s because their SE=0. For those prospects, across 150 bootstraps, the resampled median took the exact same value. Those medians are not unstable, they are as stable as they can possibly be.
OK let’s now look at the CDF Ryan relied on to argue the median is unstable
(as I did with my figure above, here I reprint only the panel with participants who correctly answered the comprehension questions).
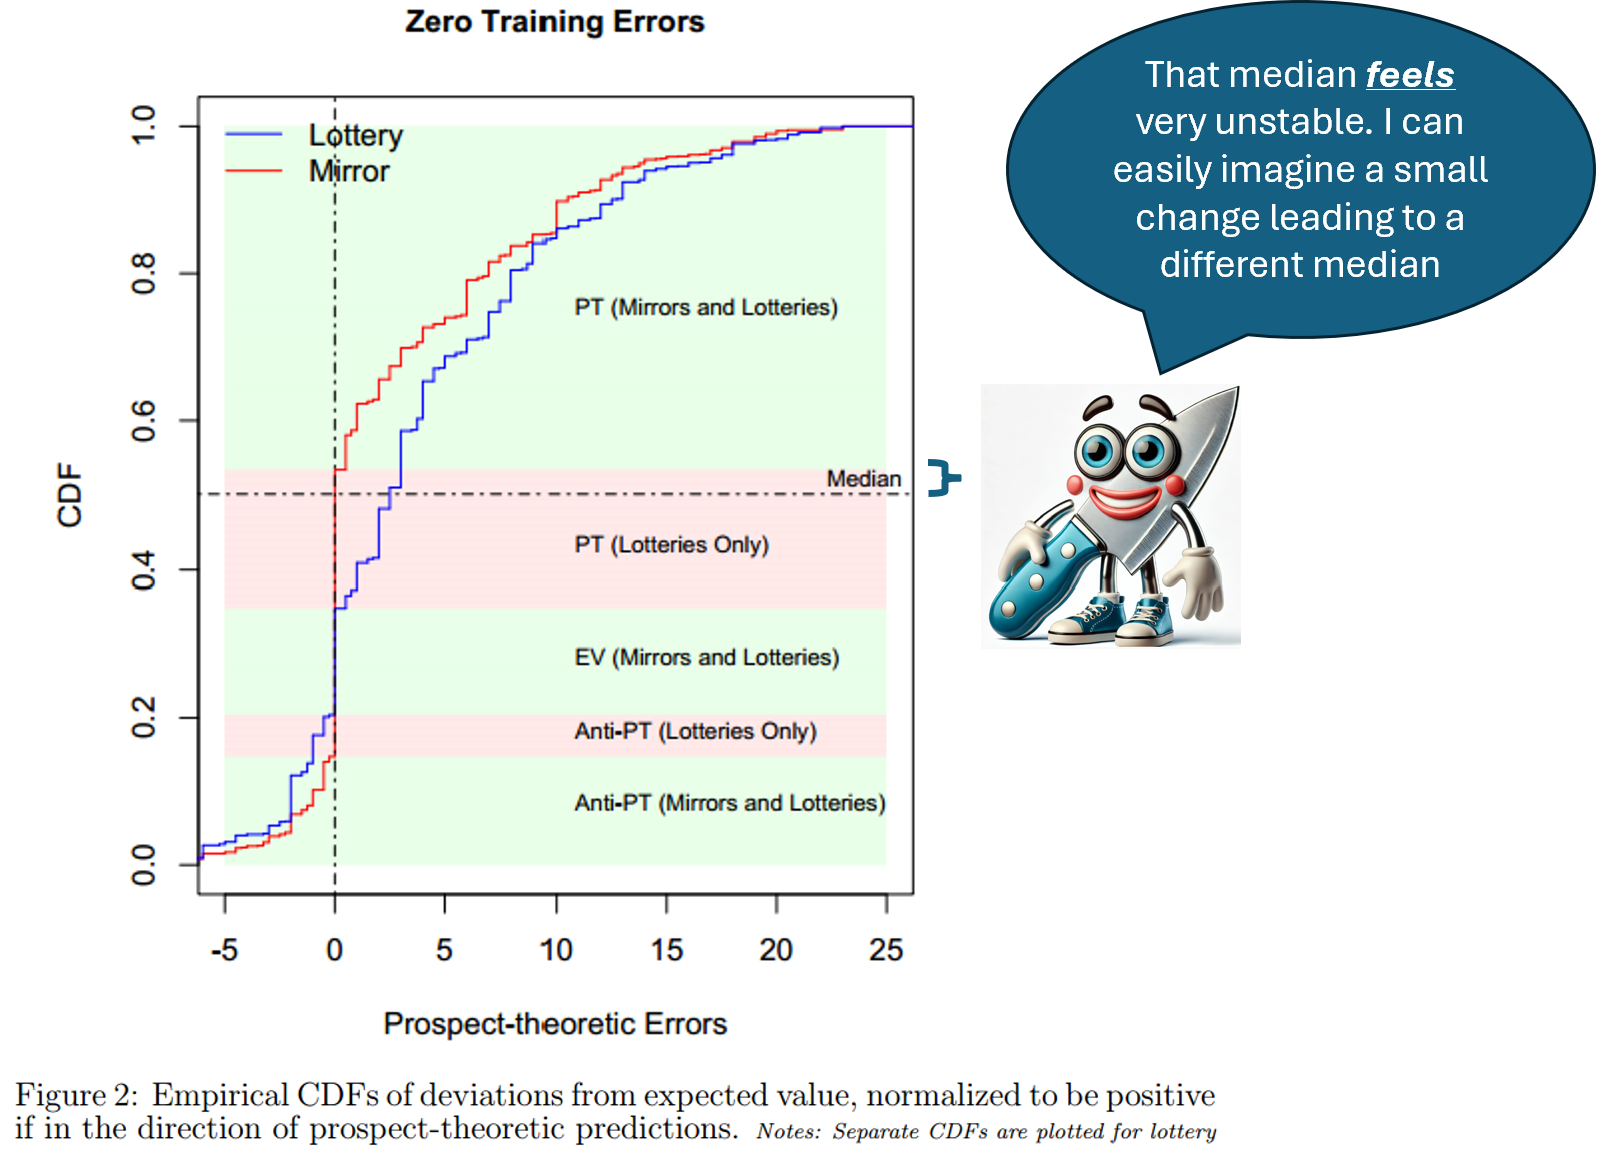
The x-axis has deviation from expected value. The y-axis cumulative share of participants. The red line, mirrors, shows lots of valuations exactly at 0, at expected value.
Aside on data visualization with CDFs. I think CDFs are not the ideal here because the data are very compressed in relation to the range of values. Most of the data is within x-axis values of -$1 and +$5, and that’s only 20% of range. So 80% of the figure represents 20% of the data. It reminds me of the electoral college map in the US; the visualized size of red and blue colors is not proportional to the number of underlying voters. I will later show alternatives to the CDF which I think get around this shortcoming.
Back to the figure above and discussing the median which is depicted by the horizontal line at 50%; it just barely cuts the red line at 0. Looking at this graph, it’s easy to imagine, a few participants behaving differently and the median no longer being 0 (see knife-clippy). The median in the CDF, however, is not the median we report.
We report medians for each prospect, the CDF aggregates across all prospects; the horizontal line is for the aggregate median. The aggregate median is less stable for reasons explained in the footnote. 1The aggregate median is less stable than most underlying medians if there are prospects with extremely few expected-value valuations, which is the case here (e.g., participants could not value prospect “A10” at expected value, it was not one of the available options to them). In addition, that CDF excludes the two prospects with the highest share of expected-value valuations in the data (G50 and L50). Over email Ryan explained that G50 and L50 prospects were excluded from the CDF because they do not involve the patterns of interest: fourfold pattern and loss aversion. G50 and L50 are excluded also from Figure 1 in his AER article, but included in Figure 3 in that article. Ryan’s response includes, in an appendix, and without discussion, CDFs for each for the prospects
In sum.
The individual medians, which we did analyze, are extremely stable.
The aggregate median, which we didn’t analyze, feels unstable looking at the above CDF.
“Knife Edge” Claim 2: medians are unrepresentative.
Ryan also interprets the CDF above as showing that the medians do not represent the underlying data well. Writing “Over most of the distribution, errors [are] … systematically prospect-theoretic … and … the median … does a poor job of representing this” (p.9).
Below, I plot the percentage of valuations that are within $1 of the mean and the median. The latter is almost comically larger. You get similar results looking within $2 (png) and $3 (png).
Fig. 3. Share of observations near the mean vs the median.
Another way to assess if the median is representative is to assess whether the results obtained with medians are obtained with other metrics. A common alternative metric is the share of participants showing a predicted effect (e.g., % of participants who were risk averse). For example, that’s what Tversky & Kahneman did. For another example, that’s what we did in most of our analyses, both in Colada[124] and our SSRN commentary.
I won’t repeat those analyses. Instead, for this post I made a new graph. I thought it captured heterogeneity of behavior in an easier to parse fashion than the CDF above does. The figure depicts the percent of participants paying above/below expected value for three prospects. 
Fig 4. Share of participants without comprehension question errors, paying above/below expected value
Two key patterns:
1. For each prospect, lotteries are quite different from mirrors.
2. In line with prospect theory, for lotteries most people are risk seeking for unlikely gains and averse for likelier ones. This is not true for mirrors
The medians accurately represented both patterns.
The medians, do miss, necessarily, just like any summary statistic does, the heterogeneity behind them. We see some of that heterogeneity here, some participants did value mirrors in line with prospect theory predictions. We believe this is due to residual confusion of lotteries with mirrors, and random responding. See Section 2.4 (pages 20-22 .pdf) in our SSRN paper.
Summary.
Because the vast majority of the analyses in our commentary are not based on medians, the validity of our conclusions does not hinge on medians being stable and representative. But, they are.
![]()
Author feedback
Our policy (.htm) is to share drafts of blog posts with authors whose work we discuss, in order to solicit suggestions for things we should change prior to posting. I shared a draft with Ryan a bit over a week ago. He caught a few things I was saying that may be misinterpreted and that I tried to improve. Following our email exchange, I thought I should explicitly say that this post is not meant to be a full response to his rejoinder. His rejoinder raises other points (to which I could write additional responses); but I thought the issue with medians was intrinsically interesting beyond this specific debate, so I wrote about that. Ryan wrote a brief response (pdf) as well.