As part of an ongoing project with Minah Jung, a nearly perfect doctoral student, we asked people to estimate the percentage of people who bought some common items in their last trip to the supermarket. For each of 18 items, we simply asked people (N = 397) to report whether they had bought it on their last trip to the store and also to estimate the percentage of other people who bought it [1].
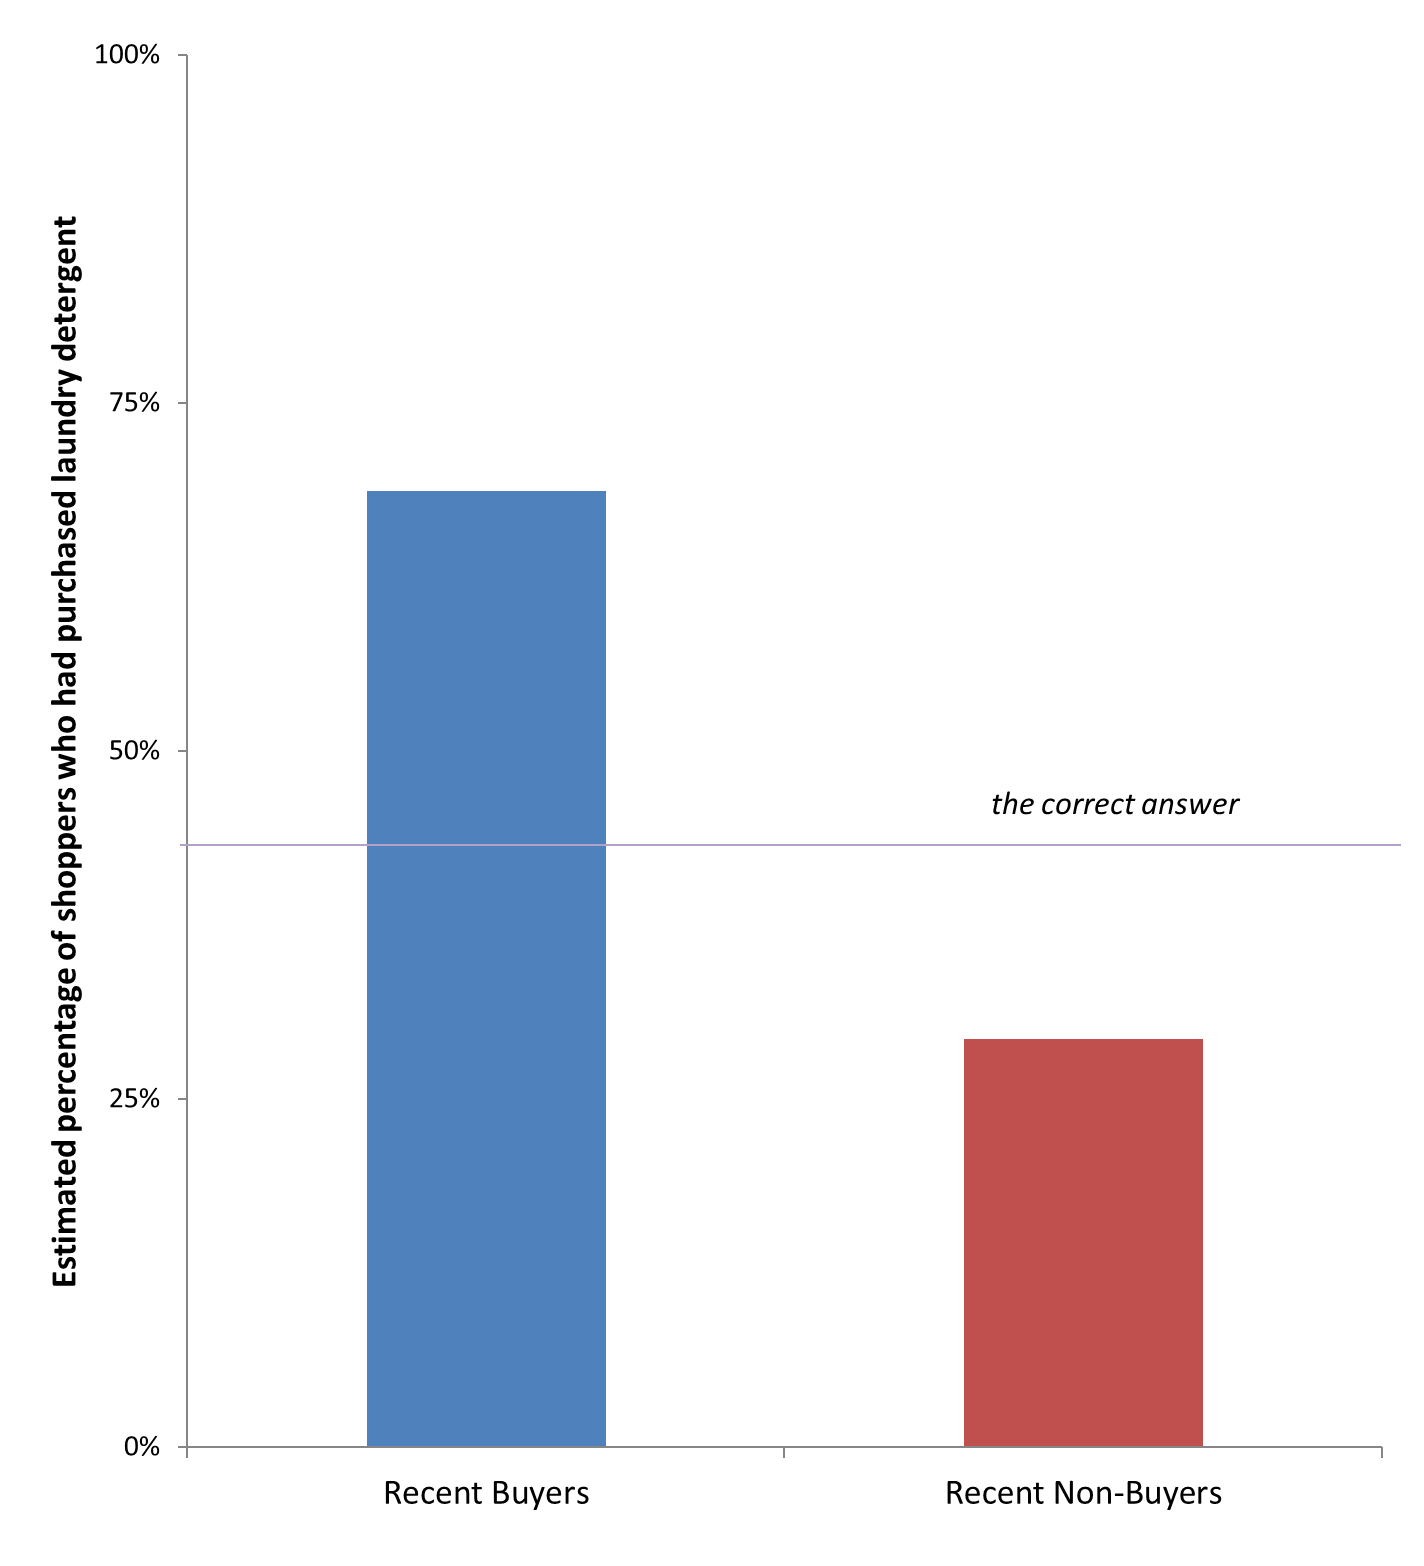
Take a sample item: Laundry Detergent. Did you buy laundry detergent the last time you went to the store? What percentage of other people [2] do you think purchased laundry detergent? The correct answer is that 42% of people bought laundry detergent. If you’re like me, you see that number and say, “that’s crazy, no one buys laundry detergent.” If you’re like Minah, you say, “that’s crazy, everyone buys laundry detergent.” Minah had just bought laundry detergent, whereas I had not. Our biases are shared by others. People who bought detergent thought that 69% of others bought detergent whereas non-buyers thought that number was only 29%. Those are really different. We heavily emphasize our own behavior when estimating the behavior of others [3].
That effect, generally referred to as the false consensus effect (see classic paper .html), extends beyond estimates of detergent purchase likelihoods. All of the items (e.g., milk, crackers, etc.) showed a similar effect. The scatterplot below shows estimates for each of the products. The x-axis is the actual percentage of purchasers and the y-axis reports estimated percentages (so the identity line would be a perfectly accurate estimate).
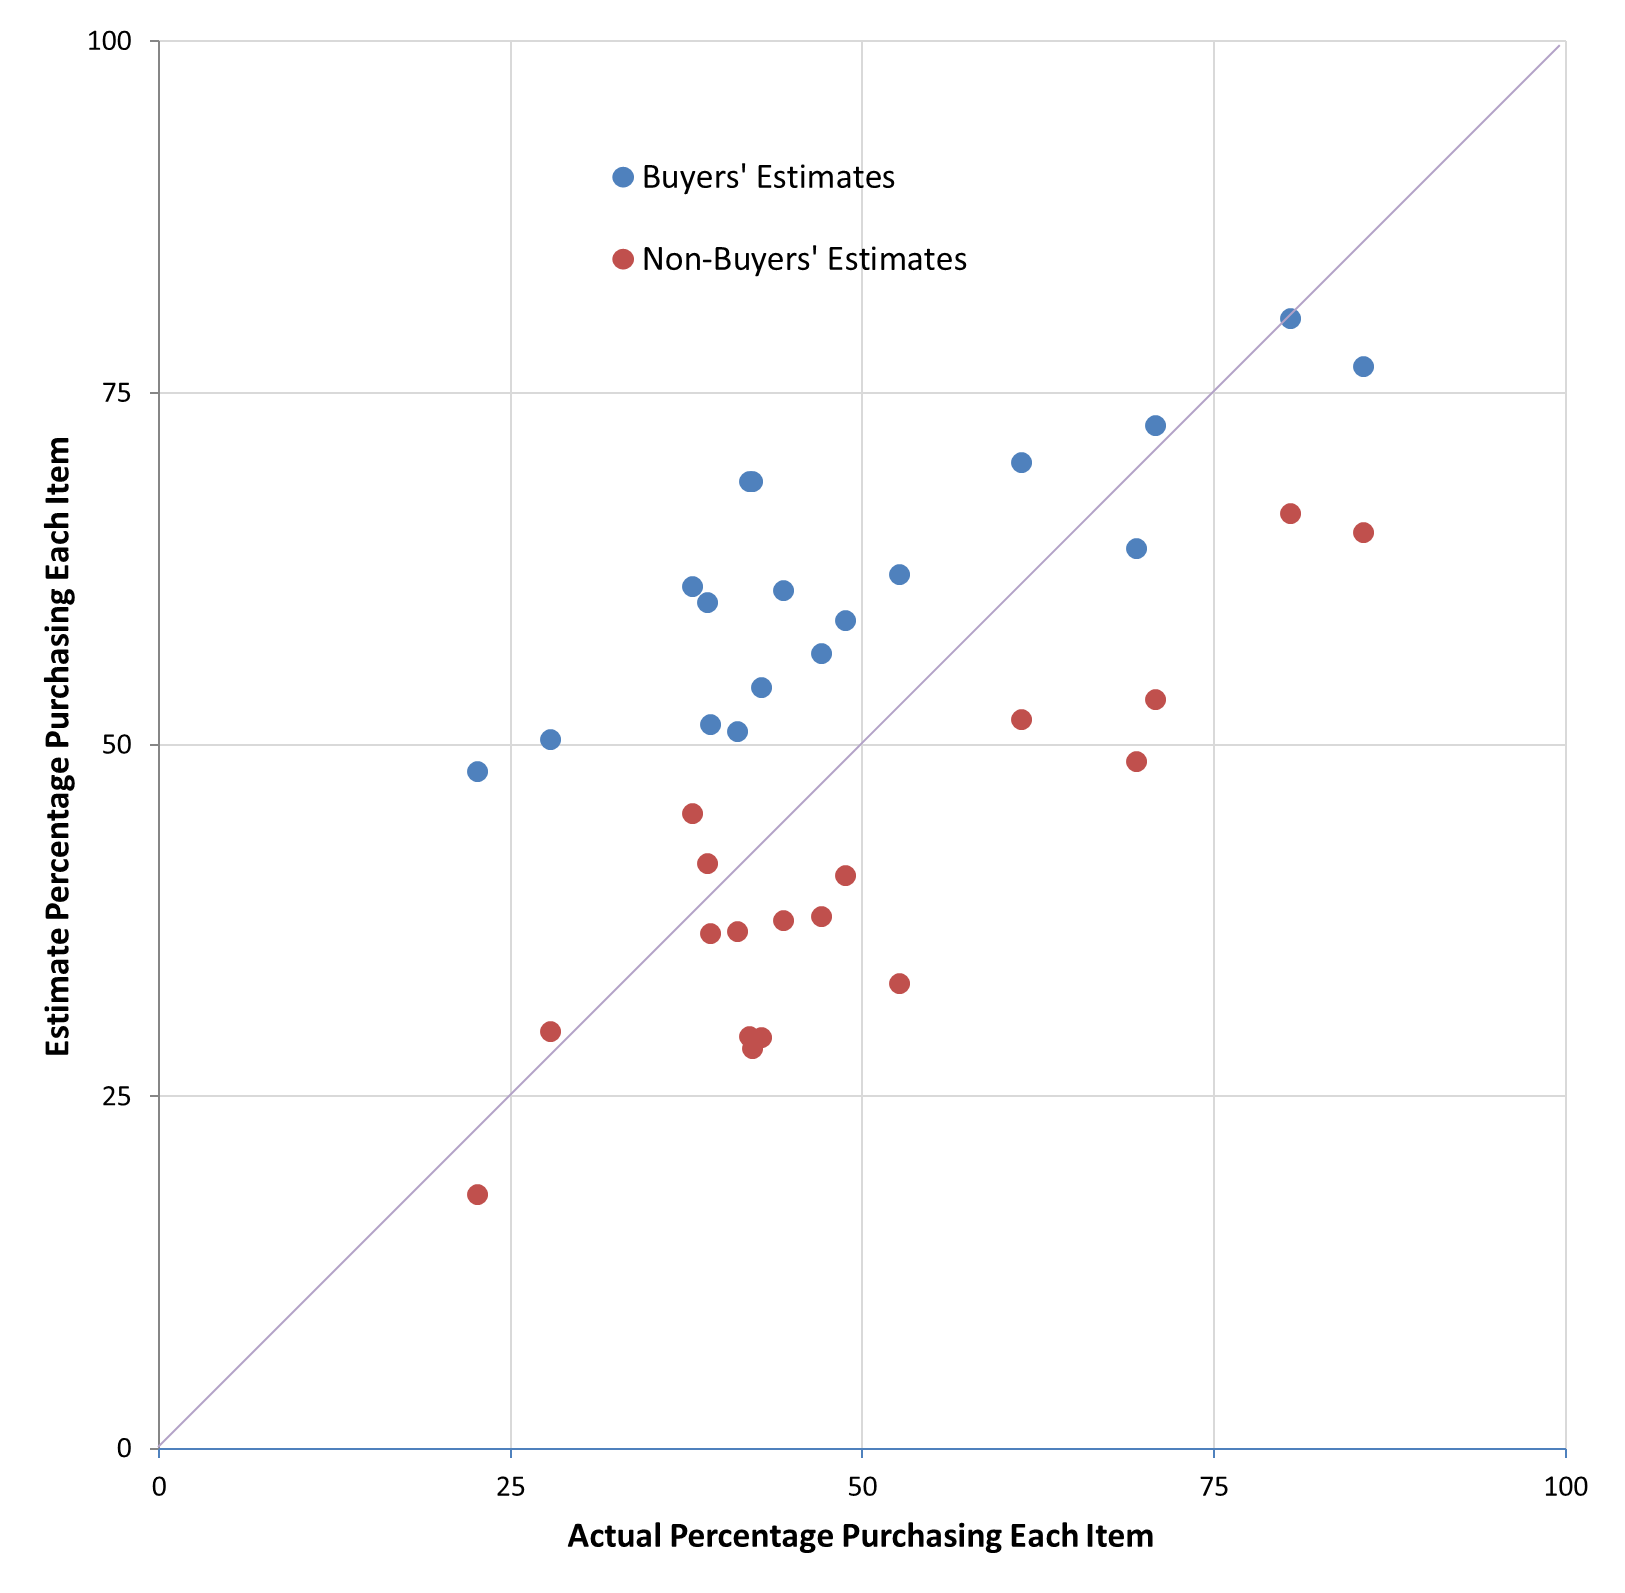
For every single product, buyers gave a higher estimate than non-buyers; the false consensus effect is quite robust. People are biased. But a second observation gets its own chart. What happens if you just average the estimates from everyone?
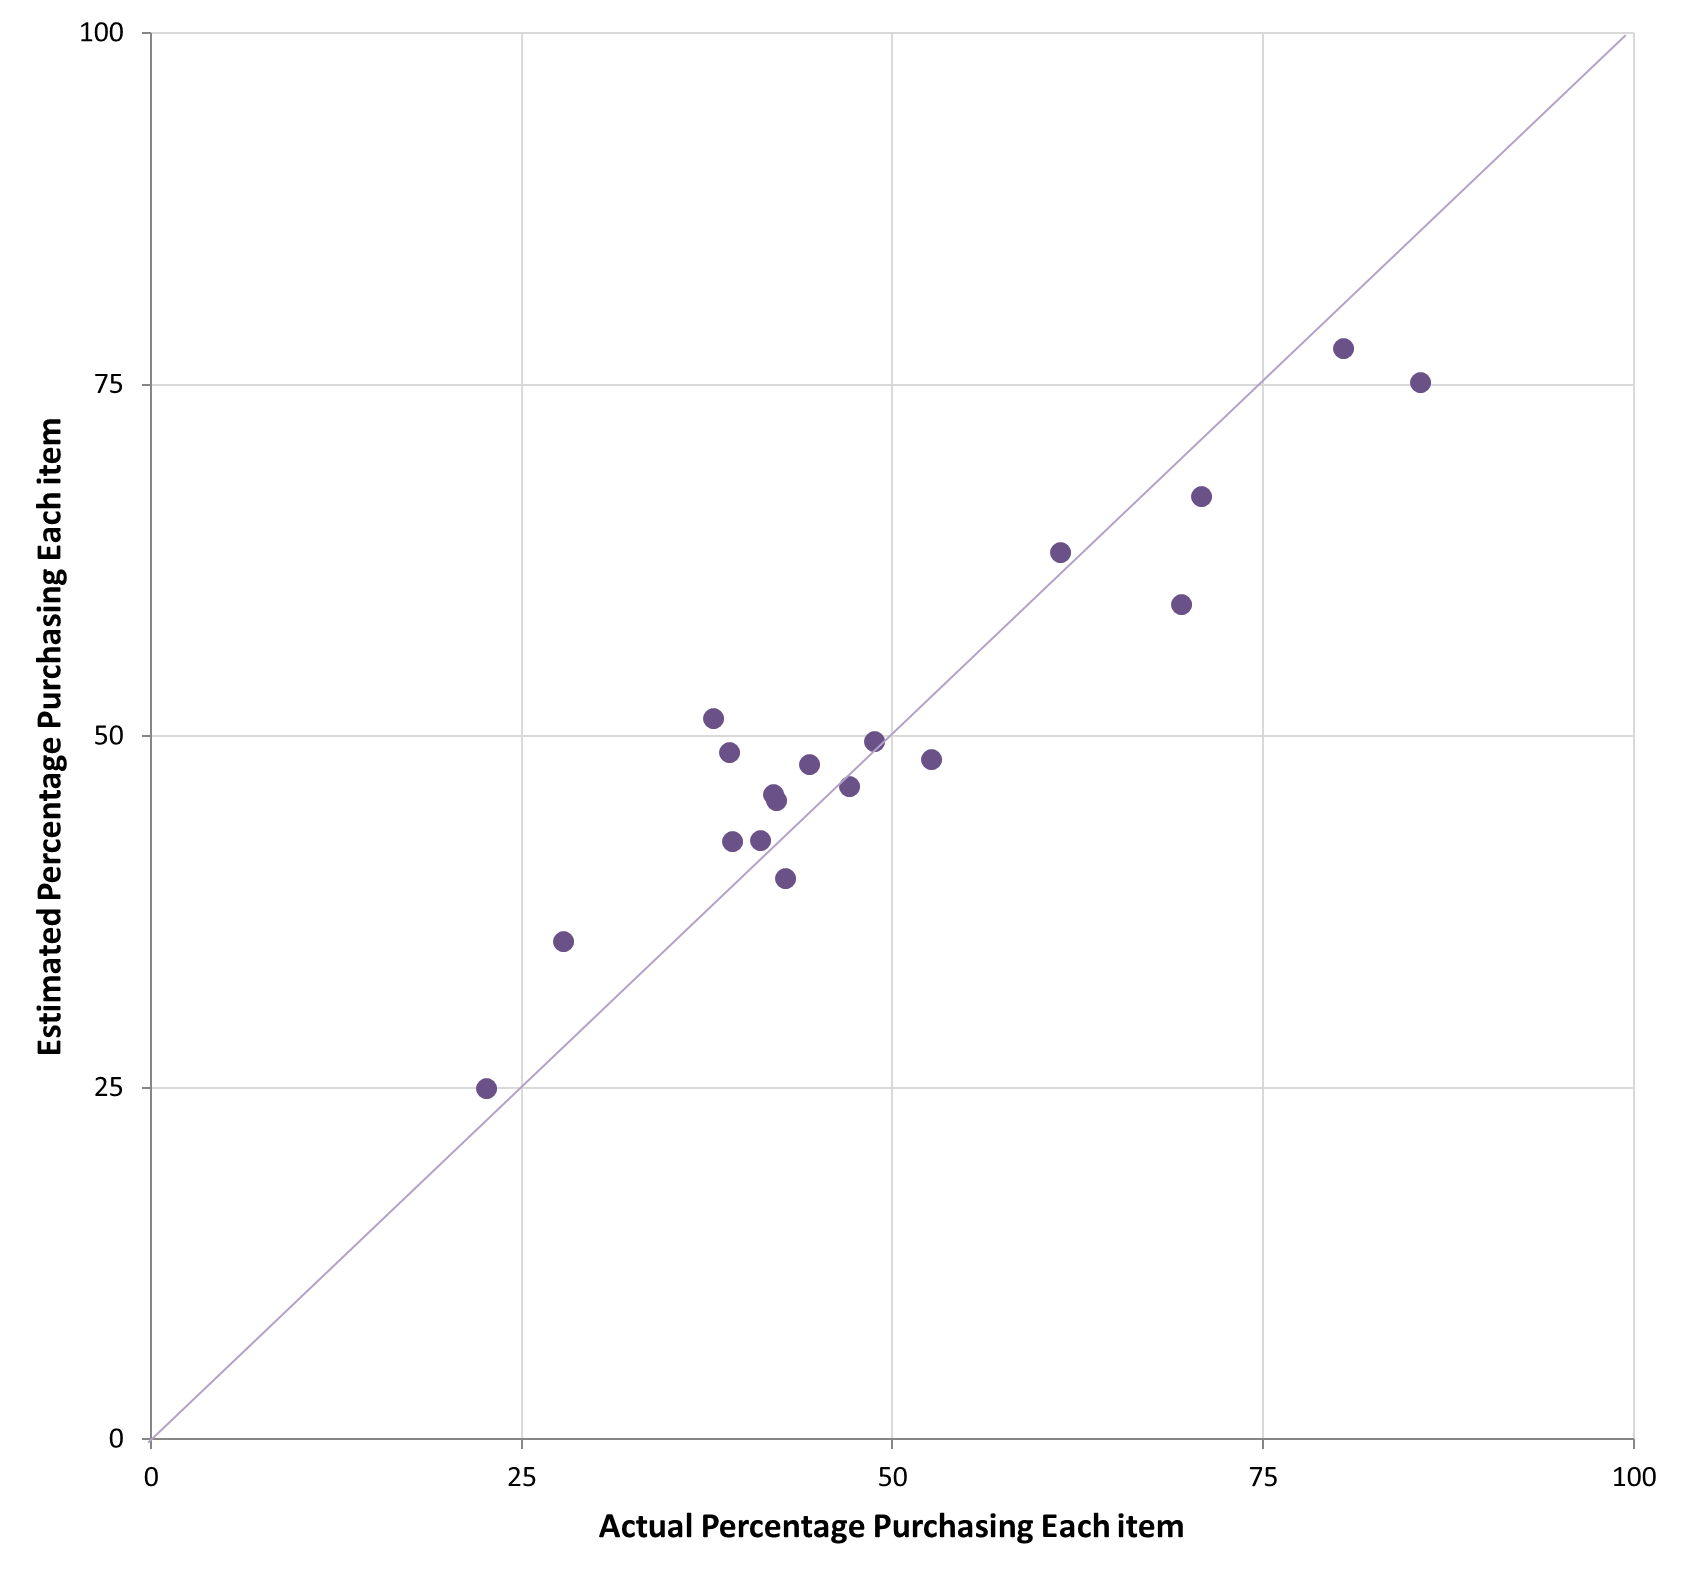
That is a correlation of r = .95.
As a judgment and decision making researcher, one of my tasks is to identify idiosyncratic shortcomings in human thinking (e.g., the false consensus effect). Nevertheless, under the right circumstances, I can be entranced by accuracy. In this case, I marvel at the wisdom of crowds. Every person has a ton of error (e.g., “I have no idea whether you bought detergent”) and a solid amount of bias (e.g., “but since I didn’t buy detergent, you probably didn’t either.”). When we put all of that together, the error and the bias cancel out. What’s left over is astonishing amounts of signal.
Minah and I could cheerfully use the same data to write one of two papers. The first could use a pervasive judgmental bias (18 out of 18 products show the effect!) to highlight the limitations of human thinking. A second paper could use the correlation (.95!) to highlight the efficiency of human thinking. Fortunately, this is a blog post, so I get to comfortably write about both.
Sometimes, even with judgmental shortcomings in the individual, there is still judgmental genius in the many.
![]()
- Truth be told, it was ever so slightly more complicated. We asked half the people to talk about purchases from their next shopping trip. To first approximation there are no differences between these conditions, so for the simplicity of verb tense I refer to the past.[↩]
- “Other people” was articulated as “other people who are also answering this question on mTurk.”[↩]
- In fact, you might recall from Colada[16] that Joe is rather publicly prone to this error.[↩]