
A new paper in Psychological Science (.htm) reports a failure to replicate Study 2 of Ariely and Wertenbroch’s influential article entitled, “Procrastination, Deadlines, and Performance: Self-Control by Precommitment.” The original study, published in Psychological Science in 2002 (.htm), found that people performed better on a set of tasks when each task had its own externally imposed deadline than when people set their own deadlines or faced a single last-day deadline for all tasks. The paper has had a lasting influence. It has been assigned reading in many economics and psychology courses, and has more than 2,100 citations on Google Scholar.
Because this paper has been so influential, it is worthwhile to take a close look at the original study to try to understand why it did not replicate. We did that. This post – and the next one – is about what we found.
***
About 20 years ago, on April 20, 2006, one of the authors of the forthcoming replication, Kyle Hyndman, received the original data files in an email sent from [email protected] [1]. And about 3 years ago, on August 9, 2023, a week after Francesca Gino sued us for $25 million, we received an out-of-the-blue email from Hyndman in which he sent those files to us. We performed quick analyses of the data, and then had a conversation with Hyndman and his co-author, Alberto Bisin. In that conversation, they told us they were going to conduct a replication, and, finding ourselves busy with the lawsuit, we left it at that.
We recently learned that their replication was forthcoming in Psychological Science. And upon reading Footnote 14 of their paper, we also learned this:
. . . In October 2024, at the request of the editors, we shared with Dan Ariely an analysis of the contents from the file purportedly for their Study 2 and asked for permission to include a summary of it in the paper. Dan Ariely denied our request, arguing, among other things, that the files we received may not be the actual data. He did not subsequently provide us with any additional data from the original paper. Consequently, we are unable to supplement our replication exercise with any additional analysis of the files we received in 2006 or any other data.
This motivated us to return to this paper and fully analyze the original data for the two main studies. We conclude that the data in Studies 1 and 2 were tampered with. In two posts, we present the evidence that led us to this conclusion. Today’s post focuses on the study that failed to replicate (Study 2), and our next post is about Study 1.
Our assessment that the data were tampered with are based entirely on the analyses presented in our posts. Readers can review the evidence and draw their own conclusions.
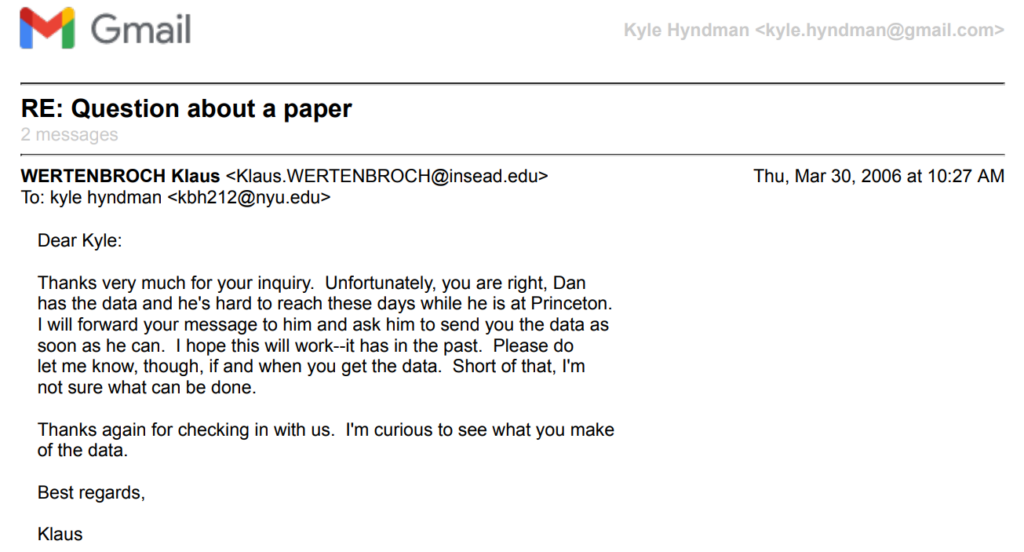
To the best of our knowledge, Klaus Wertenbroch has never had access to any version of the data for any of the studies. And, we believe it is thanks to him that we do. When Kyle Hyndman reached out to the authors back in 2006, Klaus replied with this email [2]:
Our ResearchBox contains the data and code to reproduce all of the results in this post.
Finally, it should be noted that when we shared these posts with Ariely and Wertenbroch a few weeks ago, they reached out to Psychological Science to request that the article be retracted. As of this writing, that process is ongoing.
The Study That Did Not Replicate: Study 2 of Ariely and Wertenbroch (2002)
As noted above, Ariely and Wertenbroch explored how deadlines influence performance. In a context in which people had multiple tasks to perform, the authors hypothesized that people would perform better in the face of evenly spaced deadlines for those tasks, rather than when they were all due at the end.
The experiment involved an incentivized proofreading task. Each participant received three 10-page documents, each containing 100 “grammatical and spelling errors” (p. 222). Participants were tasked with finding and correcting those errors.
Sixty participants were randomly assigned to one of three conditions, exactly 20 participants in each condition:
Condition 1. Evenly Spaced Deadlines. One document was due each week, so after 7, 14, and 21 days.
Condition 2. Set Your Own Deadlines. Participants chose their own deadlines (within 21 days).
Condition 3. Last Day Deadline. All three documents were due on the final (21st) day.
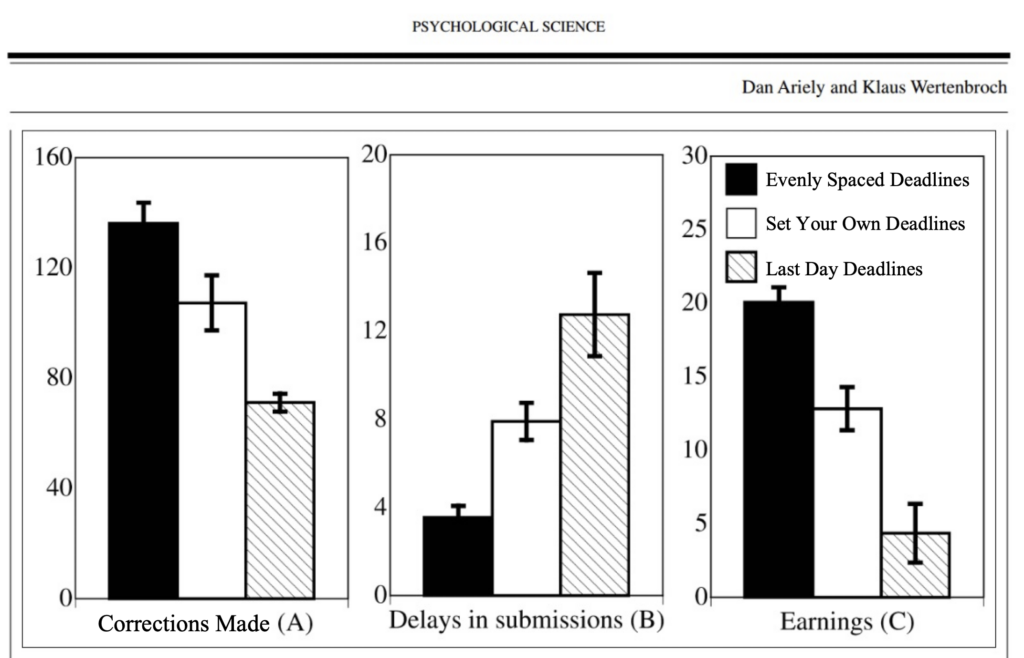
The results perfectly and strongly supported the authors’ hypothesis. Participants given evenly spaced deadlines did much better, in terms of performance, delays, and earnings [3].
Do We Have The Original Data?
As a reminder, in 2023 Hyndman sent us files he received from [email protected] in 2006. There were three Excel files – data for a pilot study, for Study 1, and for Study 2 – all with file properties indicating that the data were “Last saved by” “Dan Ariely”.
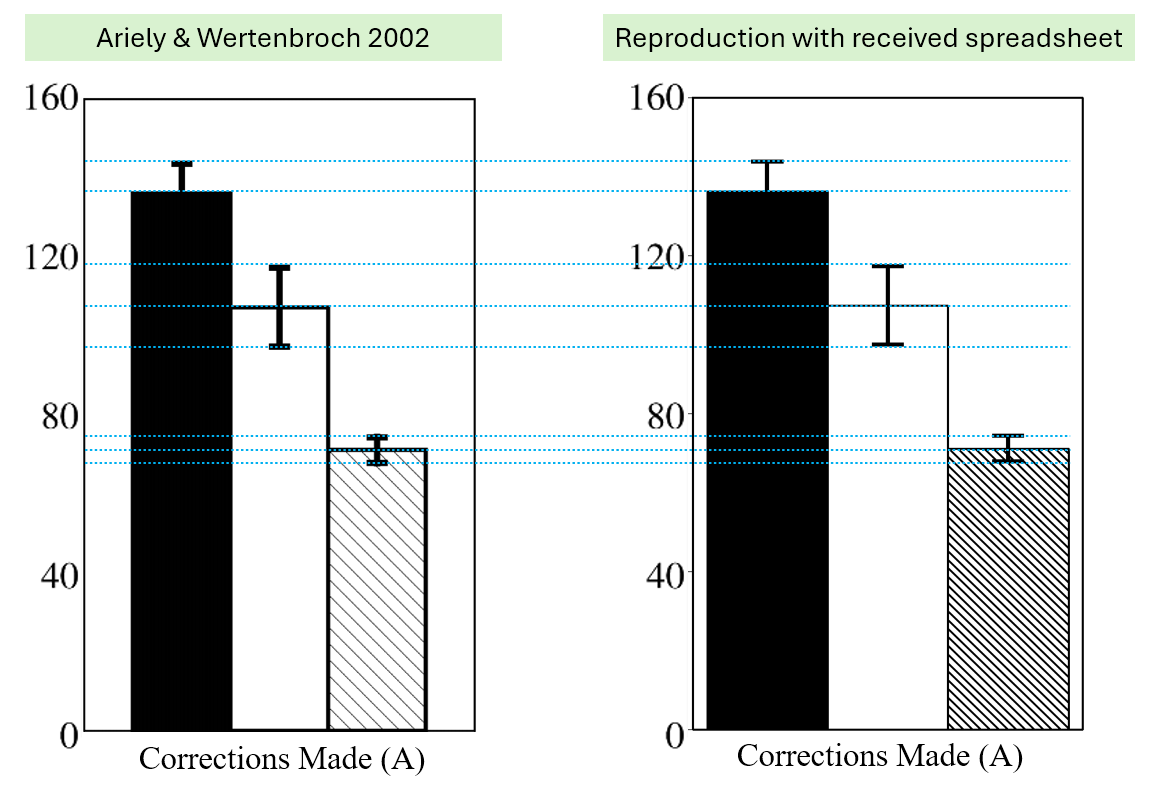
With these files we are able to reproduce all nine means and all nine standard errors shown in the figure above, as shown visually in this footnote: [4]. We also successfully reproduce the six other means reported in the text [5].
Red Flags
In our analyses we identified four major red flags. We discuss each in turn.
Red Flag #1: The Effect Is Too Big
As shown in the reprinted figure above, Ariely and Wertenbroch report a perfect pattern of results, for all three dependent variables, with a sample size of only 20 per condition. The effects are also large. Extremely, implausibly large.
Consider the proofreading performance results. Participants with Evenly Spaced Deadlines made an average of 136.1 corrections, whereas those with the Last Day Deadline made an average of only 71.1 corrections, about half as many. This effect has a Cohen’s d = 2.5, indicating that the condition means are 2.5 standard deviations apart. The correlation between experimental condition and number of corrections is r = .79.
To appreciate that this effect is just too big, consider it in the context of other effect sizes. An effect size of d = 2.5 is larger than obvious effects we notice in everyday life, effects that can easily be seen with the naked eye. For example, it is much larger than the effect of gender on height (men are taller: d ≈ 1.8) and on number of shoes owned (women own more shoes: d ≈ 1.2; see Colada[18]). It is also larger than some manipulation checks. For example, Petty and Cacioppo (1984) report that participants exposed to messages containing nine arguments said that they encountered more arguments than people exposed to messages containing three arguments. This has to be true. And it was true, but only to the tune of d = 1.49 [6]. It is not plausible that deadlines influence proofreading performance more strongly than the number of arguments influences the perceived number of arguments.
Effect sizes greater than or equal to 2.5 are not impossible – they are sometimes observed with manipulation checks – but they are extraordinarily rare for non-obvious psychological findings, particularly for a measure like proofreading error detection, which is likely to be noisy, and highly variable across people.
Another way to appreciate the enormousness of this effect is to look at the distribution of the dependent variable across conditions. The figure below shows that they barely overlap. For instance, whereas nobody in the Last Day Deadline condition made more than 100 corrections, 90% of the participants in the Evenly Spaced Deadlines condition did: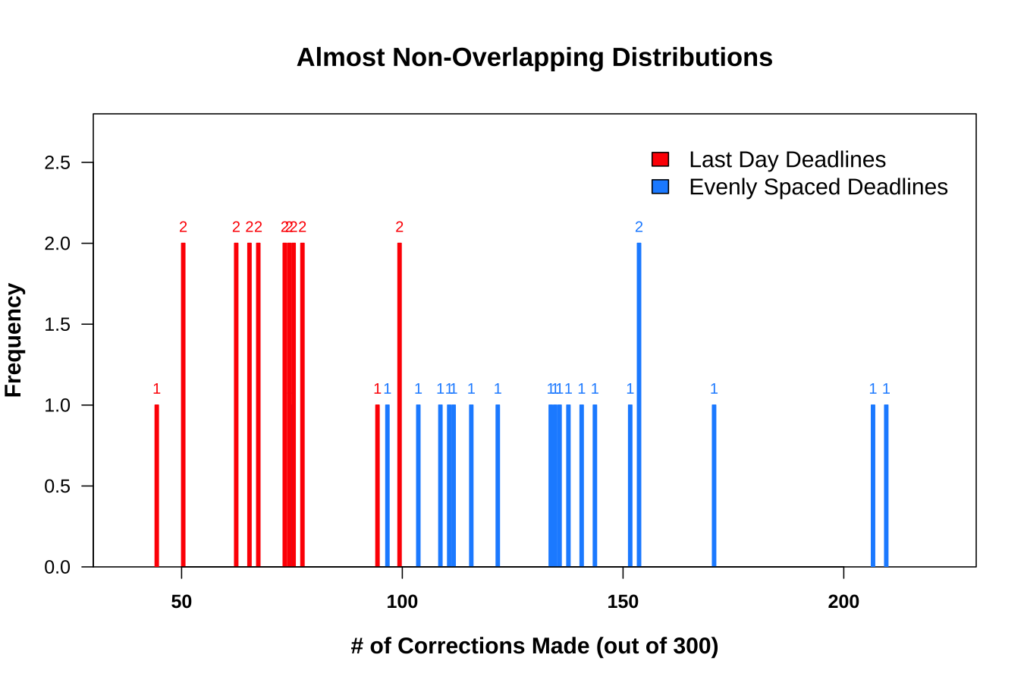
Red Flag #2: Duplicate Observations
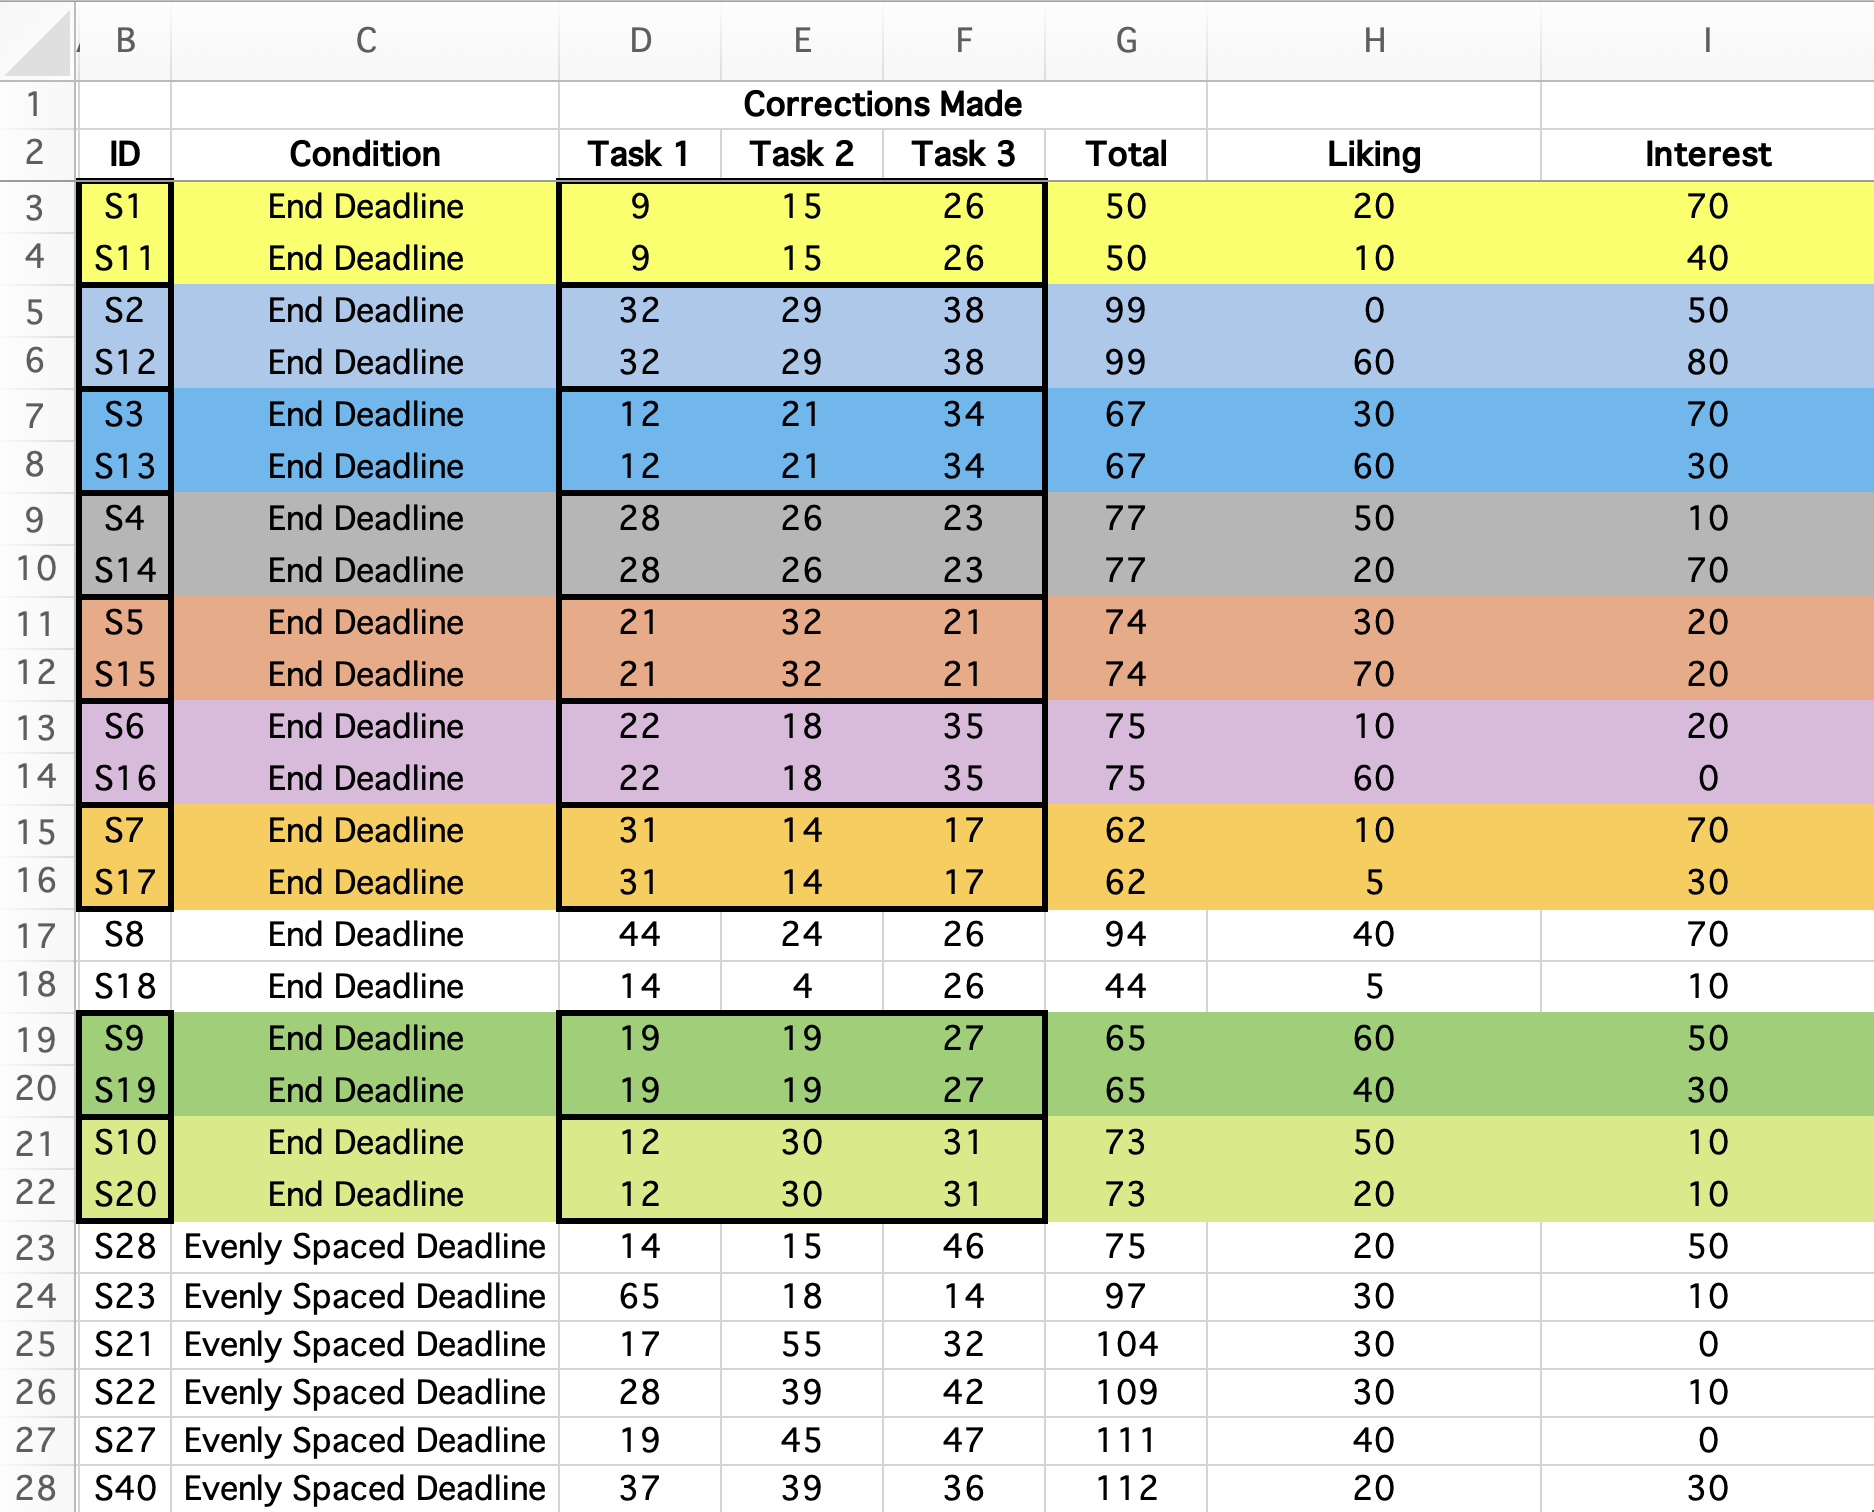
If looking at Figure 2 you thought, “wait, why are there so many red bars with 2s?”, good catch. That is weird. The 2s represent people who found exactly the same total number of corrections made across three tasks. But it’s actually weirder than that. These participants found not just the same number of corrections in total, but also made the same number of corrections for each of the three separate proofreading tasks.
Here is a screenshot of the original data file, formatted and sorted to be easier to digest:
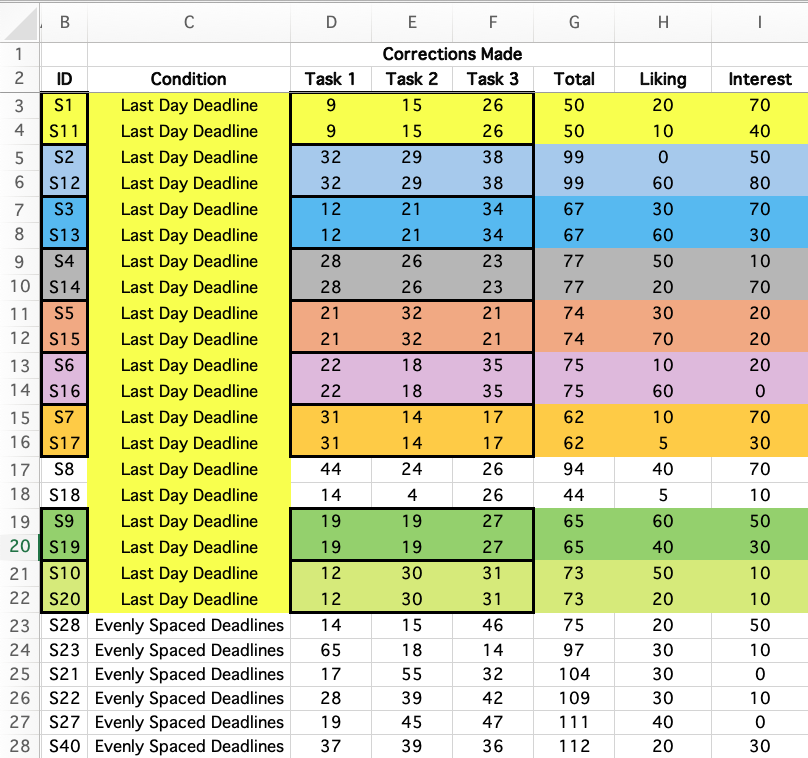
We see that 18 of the 20 participants in the Last Day Deadline condition had a “Corrections Twin”, another participant who found exactly the same number of errors for each of the three proofreading tasks. Interestingly, these twins have ID numbers that are exactly 10 positions apart (e.g., subject S1 and subject S11 are twins; so are S7 and S17; etc.). (There were no error twins in the other two conditions.)
The existence of so many of these twins – and all of them in only one condition – is inconsistent with these data being real.
Red Flag #3: Things That Should Be Very Highly Correlated Aren’t Correlated At All
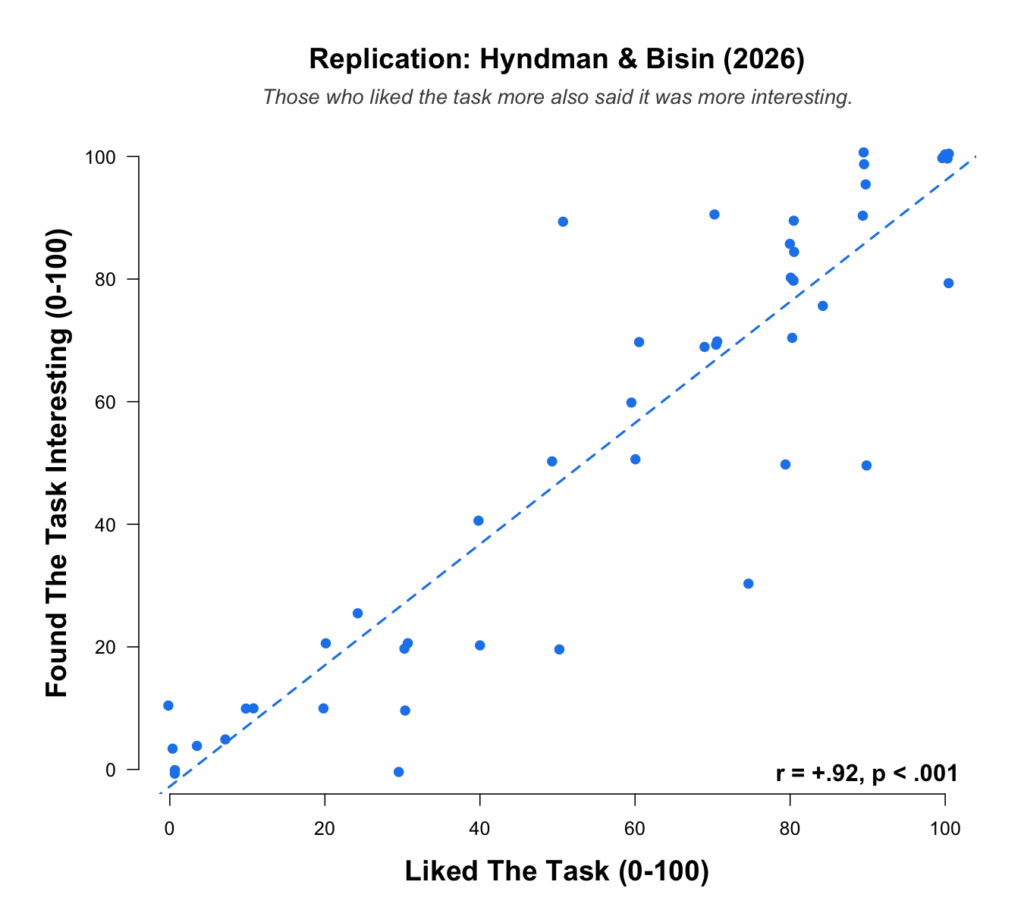
At the end of their study, Ariely and Wertenbroch purportedly “asked participants to evaluate their overall experience [of the proofreading task] on five attributes: how much they liked the task, how interesting it was, how good the quality of the writing was, how good the grammatical quality was, and how effectively the text communicated the ideas contained in it” (p. 223). These questions were answered on scales ranging from 0 to 100. The replicators asked the same questions to their participants.
You might expect these judgments to be correlated. For example, if someone says they liked the task, you might also expect them to say that it was interesting.
In the replication, this was (super) true. Controlling for experimental condition, the partial correlation between liking and interest was, quite sensibly, close to perfect [7]:
But in the original data, this relationship was not only imperfect; it was not there at all. Participants who said they liked the task more did not say that they found the task to be more interesting:
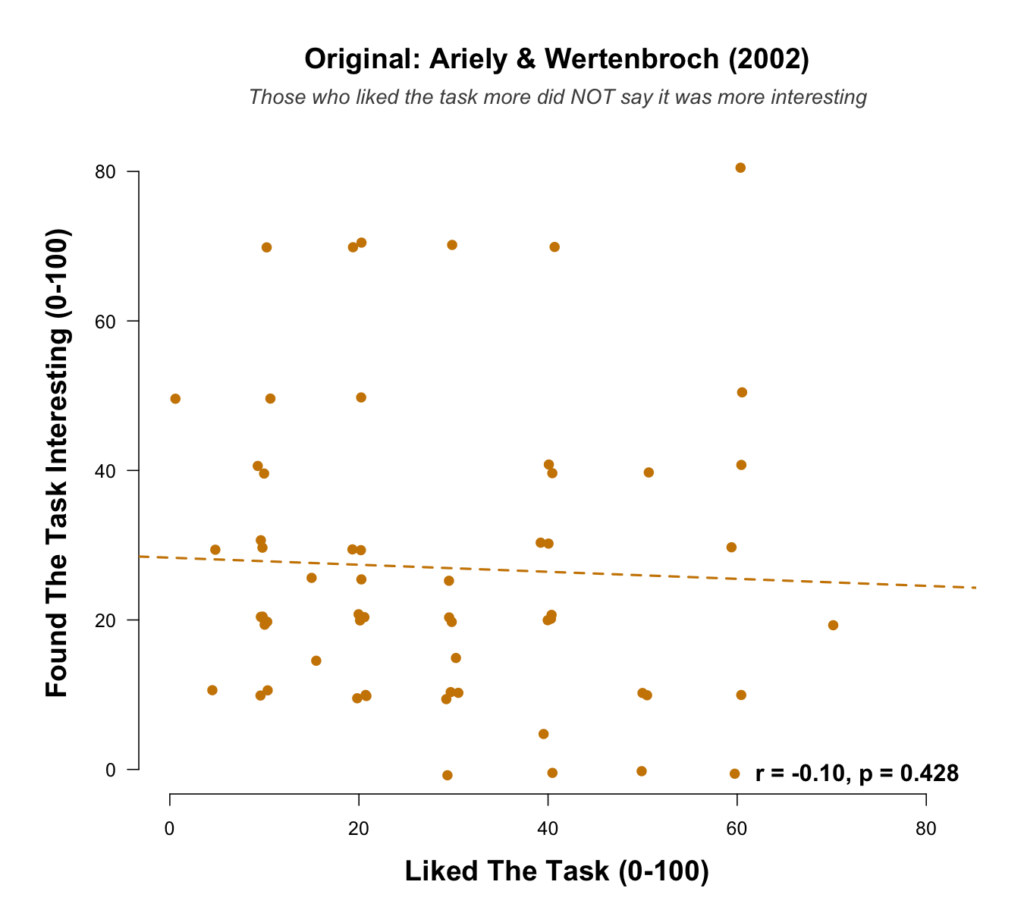
In total, there are five subjective measures. In the replication, the (partial) correlations among these five measures range from +.63 to +.92. They are all large and very highly significant (ps < 0.0000024). In the original data, these correlations range from -.29 to +.18, and none of them are both positive and significant. This is very strange.
The problem is not limited to these subjective measures. Consider the fact that people did three very similar proofreading tasks, each with 100 mistakes. Surely, we’d expect people who do better on one task to also do better on another, nearly identical task. That simple fact should manifest in extremely large correlations between performance on one task and performance on another. And in the replication data it does, as the correlations range from +.74 to +.90. But in the original data it doesn’t, as the correlations range from +.03 to +.27.
Finally, consider that participants were asked to report how many minutes they spent on each of the three tasks. Again, we’d expect those who said they spent more time on one task to be more likely to say they spent more time on another, nearly identical task. And so we’d expect these variables to be very highly correlated. Once again, within the replication data they were – the correlations ranged from +.79 to +.95 – and within the original data they were not – the correlations ranged from +.05 to +.17.
The correlations we have reviewed in this section are essentially just sanity checks. Does liking correlate with interest? Does performance correlate with performance? Does reported time spent correlate with reported time spent? Sane data pass these checks. Insane data do not. The replication data are sane. The original data are not.
Red Flag #4: No Rounding In Self-Reported Minutes
As you’ll recall from a minute ago, Ariely and Wertenbroch (2002) purportedly asked participants to “estimate how much time they had spent on each of the three tasks” (p. 223). When people provide estimates like this, they tend to round. They usually say “20 minutes” or “30 minutes” instead of “17 minutes” or “32 minutes”. And, indeed, when the replicators asked people to report how many minutes they spent on each of the three tasks, 85% of them gave a round number:
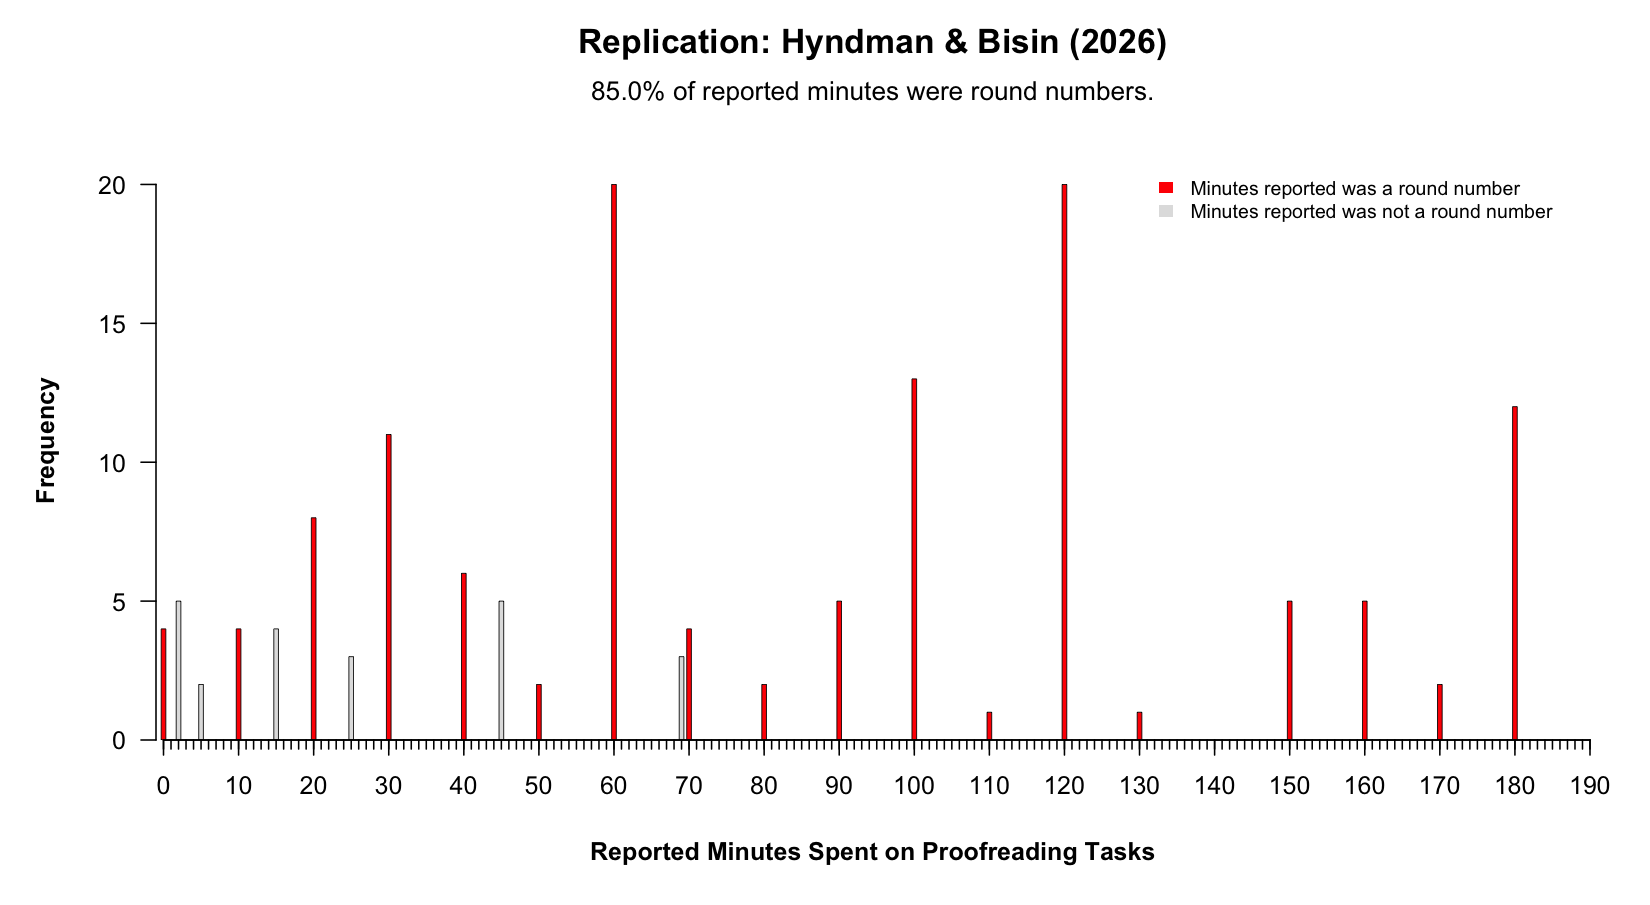
This is what we’d expect humans to do.
But in the original data, they did not do that. Only 11.7% of estimated minutes were round, consistent with the 10% you’d expect by chance alone:
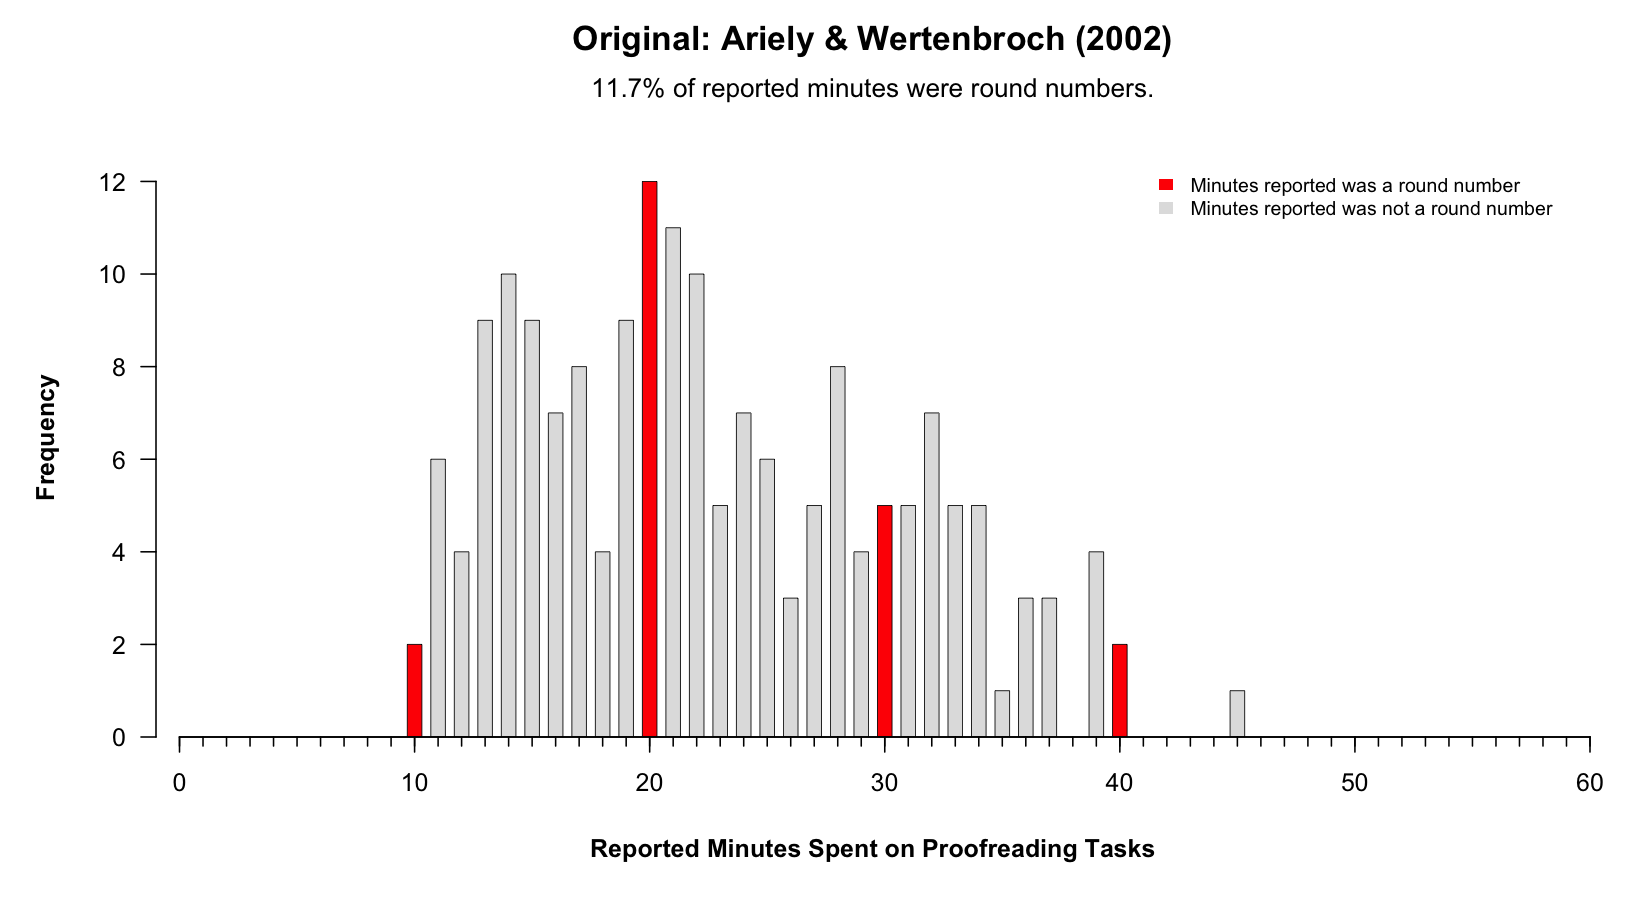 This is not what we’d expect humans to do.
Conclusion
We are unable to generate a benign explanation for all of the anomalies presented here. The original findings are too large and yet they do not replicate; there are duplicated observations; correlations that should be very strong are often non-existent; and values that should be rounded are not rounded. Based on this evidence, we believe the data for Study 2 of Ariely and Wertenbroch (2002) were severely tampered with or fabricated to produce the desired results.
In our next post, we share analyses of the Study 1 data file that Hyndman received from [email protected]. That experiment is quite different. Our analyses are quite different. But our conclusions are quite similar.

Author Feedback
About 6 weeks ago, on July 20th, 2026, we shared drafts of our posts with the original authors (Dan Ariely and Klaus Wertenbroch), the replication authors (Kyle Hyndman and Alberto Bisin), and the editor-in-chief of Psychological Science (Simine Vazire).
Klaus Wertenbroch sent us a response in which he begins by thanking Hyndman and Bisin for having done the replication. He restates that he never had access to the data for any of the studies. He distinguishes between demand for precommitment, a finding that was replicated by Hyndman and Bisin and which is consistent with earlier work by him and others, and the effectiveness of such precommitments in these specific studies, which did not replicate. And he indicated that he has asked the editor to retract the paper.
You can read his response in full (PDF).
Dan Ariely did not reply to any of the three emails we sent him. But on August 7th, he wrote on LinkedIn (htm) and on his personal website (htm): “. . . Recently, I was made aware that data underlying a 2002 paper about deadlines and procrastination that I co-authored contained serious anomalies. The documentary record I have at my disposal today about those experiments isn’t sufficient to answer the questions that have been raised, and more than two decades, and hundreds of experiments later, my memory is similarly insufficient. Moving forward, my responsibility lies in ensuring accuracy – in updating the record on these experiments and, along with my co-author, cooperating with the journal that first published our paper to support their reviews and retraction processes.”
Neither LinkedIn nor Dan’s website allowed archive.org to save copies; so we screen recorded both pages (mp4).
Kyle Hyndman and Alberto Bisin asked us to include this statement: “As stated in the posts, in April 2006, we received three data files attached to an email sent from Dan Ariely’s MIT email account, with no stated restrictions on their use. In August 2023, we provided those files to Uri Simonsohn, Joe Simmons and Leif Nelson to obtain their professional assessment. We did not participate in Data Colada’s analysis or in drafting the posts. Our independent replication relies on newly collected data and stands on its own methodological findings. Questions concerning the provenance or integrity of the historical files should be addressed by Data Colada, Dan Ariely, and the institutions with appropriate responsibility for those questions.”
Simine Vazire indicated that she is only allowed to say that Psychological Science is considering “best next steps regarding the 2002 paper in accordance with COPE guidelines.”
Footnotes.
- PDF copies of this email – and related emails (including the one posted below) – are available in both the replicatiors’ ResearchBox (3063) and this blogpost’s ResearchBox (7135). Throughout this post, we refer to these emailed files as the “original” data files, though previous (unaltered) versions may have existed[↩]
- As mentioned in our previous footnote, this email is included in Hyndman and Bisin’s ResearchBox (.htm). Wertenbroch gave us permission to include this email in our post.[↩]
- Ariely and Wertenbroch refer to their performance measure as “errors detected”, but in this post we refer to it as “corrections made”, and we have altered the figure below accordingly. We made this change because readers may confuse participants’ “error detection” in a proofreading task with our own “error detection” in the original dataset. This nomenclature hopefully prevents any such confusion. We have also altered the the figures below so they contain our preferred and more intuitive condition names.[↩]
- We reproduce the published article’s figures with the spreadsheets we received. For example, here is Panel A of Figure 2:
 [↩]
[↩] - We do not, however, reproduce all of the F values in the published paper, the statistical results purportedly obtained when testing the differences among those means. We were puzzled as to why until we discovered a previous version of the manuscript still posted to INSEAD’s website (.htm). It is INSEAD working paper “2001/09/MKT” and the title page indicates that it is “Under review, Psychological Science.” It turns out that while some of the means changed between the working and published versions of the paper, the F values remained the same. But when means change, so do F values that compare those means. Therefore, the F values are necessarily wrong in at least one of the two versions of the paper. We believe the authors changed the means reported in the paper but forgot to update the F values. We provide evidence of this in this Appendix: (.pdf).[↩]
- From Petty and Cacioppo (1984, p. 74): Participants “were asked, ‘About how many arguments did the author put forth in favor of the advocated proposal?’ Subjects were free to record any number they wanted, and those exposed to the nine-argument messages claimed that there were significantly more arguments in their messages (M = 6.60) than did subjects exposed to the three-argument messages (M = 3.68), F(1, 158) = 87.17, p < .0001.” You can compute Cohen’s d from this F-value: d = 2*sqrt(F/dferror) = 2*sqrt(87.17/158) = 1.49.[↩]
- In this section, we examine and report partial correlations that control for experimental condition. A genuine association between liking a task and finding it interesting should emerge within conditions, not merely across them. By contrast, someone fabricating data to create condition differences could inadvertently induce positive raw correlations simply by assigning higher values to both variables in one condition than another.[↩]