Can you have too many options in the menu, too many talented soccer players in a national team, or too many examples in an opening sentence? Social scientists often hypothesize u-shaped relationships like these, where the effect of x on y starts positive and becomes negative, or starts negative and becomes positive. Researchers rely almost exclusively on quadratic regressions to test if a u-shape is present (y = ax+bx2), typically asking if the b term is significant [1].
The problem is that quadratic regressions are not diagnostic regarding u-shapedness. Under realistic circumstances the quadratic has 100% false-positive rate, for example, concluding y=log(x) is u-shaped. In addition, under plausible circumstances, it can obtain 0% power: failing to diagnose a function that is u-shaped as such, even with an infinite sample size [2].
With Leif we wrote Colada[27] on this problem a few years ago. We got started on a solution that I developed further in a recent working paper (SSRN). I believe it constitutes the first general and valid test of u-shaped relationships.
January 2019 update: paper is now published (.pdf)
Two-lines
The test consists of estimating two regression lines, one for ‘low’ values of x, another for ‘high’ values of x. A U-shape is present if the two lines have opposite sign and are individually significant. The difficult thing is setting the breakpoint, what is a low x vs high x? Most of the work in the project went into developing a procedure to set the breakpoint that would maximize power [3].
The solution is what I coined the “Robin Hood” procedure; it increases the statistical power of the u-shape test by setting a breakpoint that strengthens the weaker line at the expense of the stronger one .
The paper (SSRN) discusses its derivation and computation in detail. Here I want to focus on its performance.
Performance
To gauge the performance of this test, I ran a horse-race between the quadratic and the two-lines procedure. The image below previews the results.
The next figure has more details.
It reports the share of simulations that obtain a significant (p<.05) u-shape for many scenarios. For each scenario, I simulated a relationship that is not u-shaped (Panel A), or one that is u-shaped (Panel B). I changed a bunch of things across scenarios, such as the distribution of x, the level of noise, etc. The figure caption has all the details you may want.
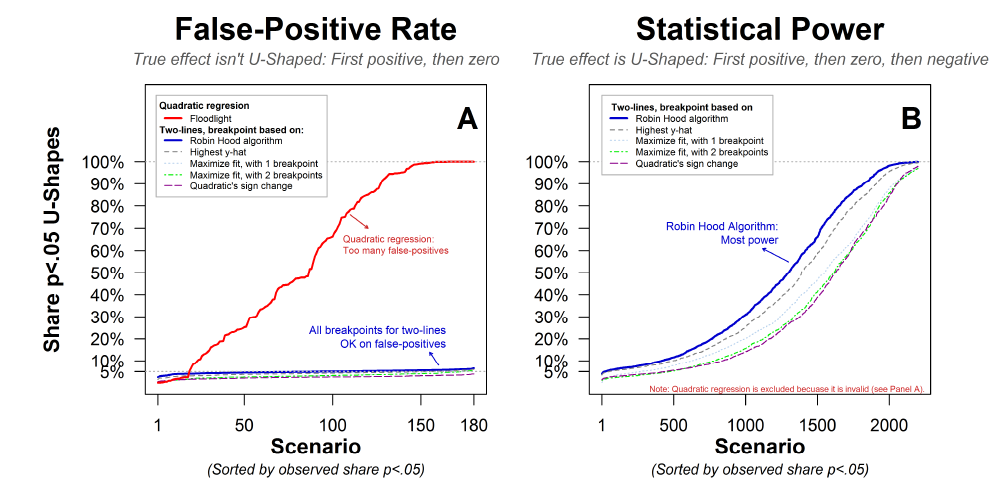
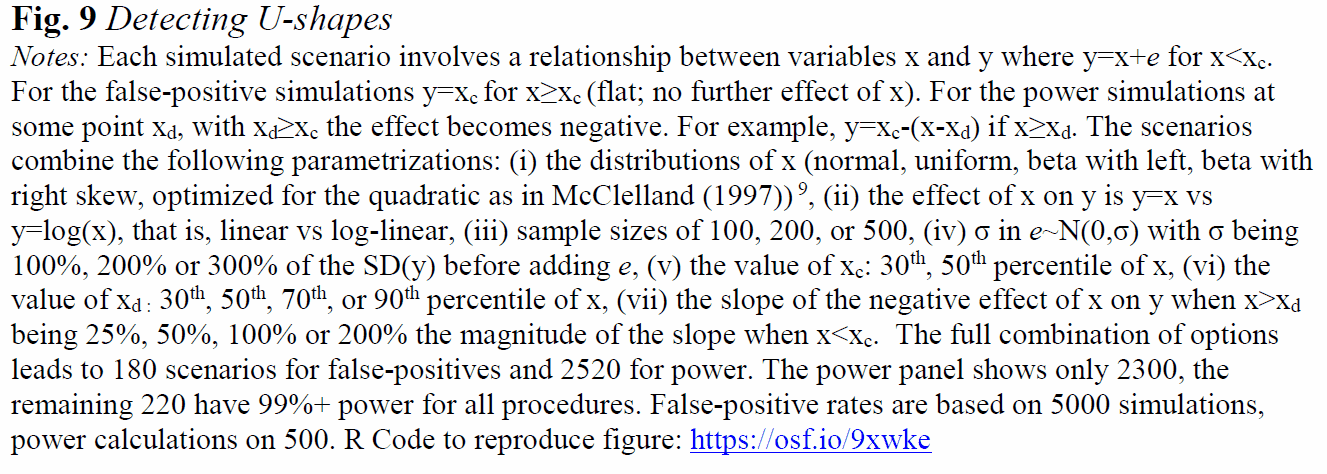
Panel B – now excluding the fundamentally invalid quadratic regression – shows that for the two-lines test, Robin Hood is the most powerful way to set the breakpoint. Interestingly, the worst way is what we had first proposed in Colada[27], splitting the two lines at the highest point identified by the quadratic regression. The next worst is to use 3 lines instead of 2 lines.
Demonstrations.
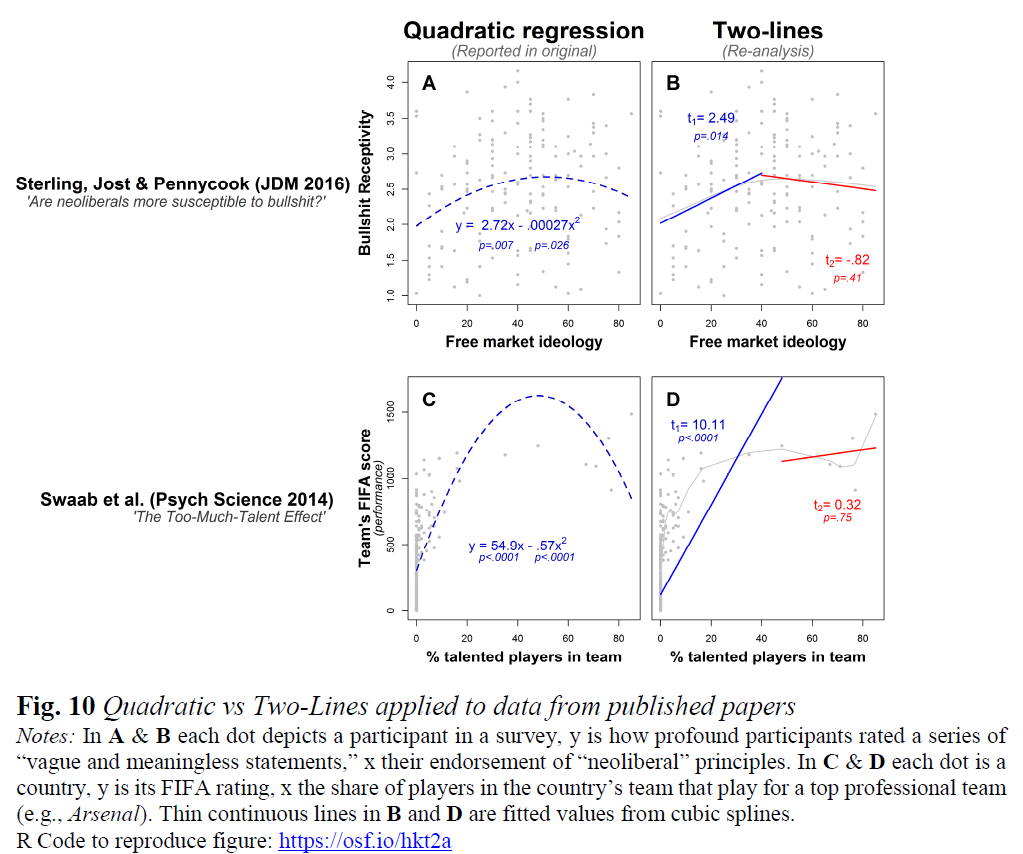
The next figure applies the two-lines procedure to data from two published psych papers in which a u-shaped hypothesis appears to be spuriously supported by the invalid quadratic regression test. In both cases the first positive line is highly significant, but the supposed sign reversal for high xs is not close.
Fortunately the two-lines test does not refute all hypothesized u-shapes. A couple of weeks ago Rogier Kievit tweeted about a paper of his (.htm) which happened to involve testing a u-shaped hypothesis. Upon seeing their Figure 7 I replied:
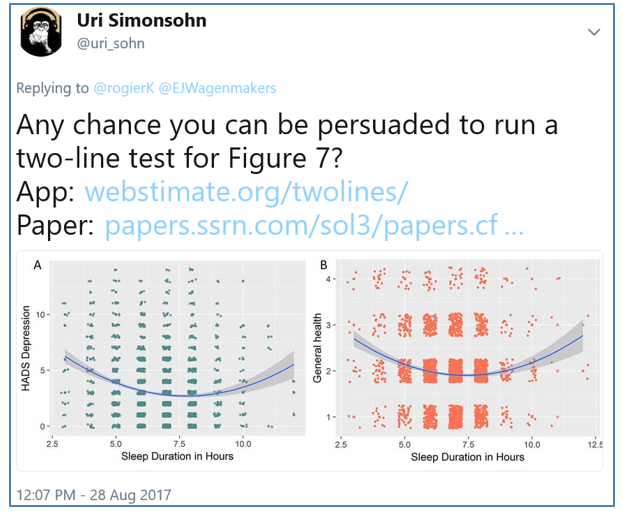
Rogier's reply:
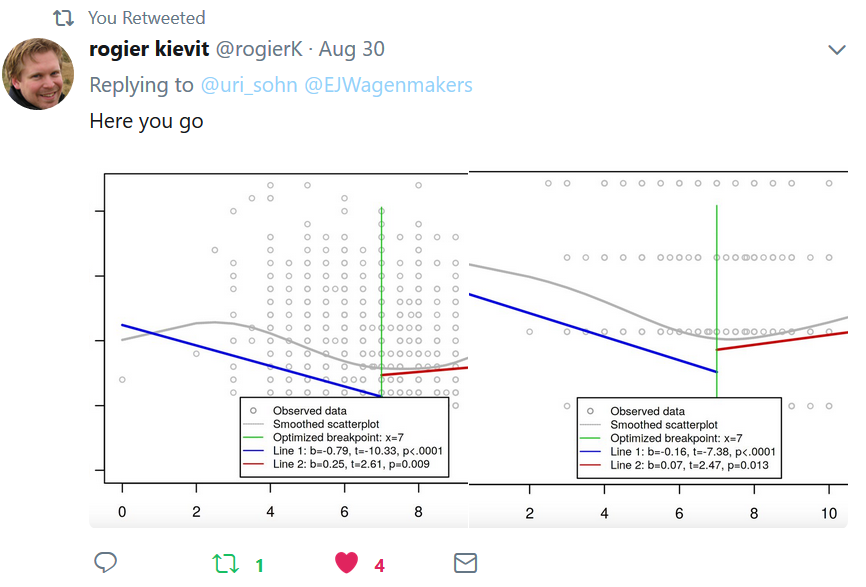
Both u-shapes were significant via the two-lines procedure.
Conclusions
Researchers should continue to have u-shaped hypotheses, but they should stop using quadratic regressions to test them. The two lines procedure, with its Robin Hood optimization, offers an alternative that is both valid and statistically powerful
PD (2017 11 02): After reading this post, Yair Heller contacted me, via Andrew Gelman, sharing an example where the two-lines test had an elevated false-positive rate (~20%). The problem involved heteroskedasticy, Yair considered a situation where noise was grater in one segment (the flat one) than the other. Fortunately it turned out to be quite easy to fix this problem: the two-lines test should be conducted by estimating regressions with "robust" standard errors, that is, standard errors that don't assume the same level of noise throughout. The online app will soon be modified to compute robust standard errors, and the paper will reflect this change as well. Thanks to Yair & Andrew. (See new R code showing problem and solution).
![]()
Frequently Asked Questions about two-lines test.
1. Wouldn't running a diagnostic plot after the quadratic regression prevent researchers from mis-using it?
Leaving aside the issue that in practice diagnostic plots are almost never reported in papers (thus presumably not run), it is important to note that diagnostic plots are not diagnostic, at least not of u-shapedness. They tell you if overall you have a perfect model (which you never do) not if you are making the right inference. Because true data are almost never exactly quadratic, diagnostic plots will look slightly off whether a relationship is or is not u-shaped. See concrete example (.pdf).
2. Wouldn't running 3 lines be better, allowing for the possibility that there is a middle flat section in the U, thus increasing power?.
Interestingly, this intuition is wrong, if you have three lines instead of two, you will have a dramatic loss of power to detect u-shapes. In Panel B in the figure after the fallen horse, you can see the poorer performance of the 3-line solution.
3. Why fit two-lines to the data, an obviously wrong model, and not a spline, kernel regression, general additive model, etc?
Estimating two regression lines does not assume the true model has two lines. Regression lines are unbiased estimates of average slopes in a region, whether the slope is constant in that region or not. The specification error is thus inconsequential. To visually summarize what the data look like, indeed a spline, kernel regression, etc., is better (and the online app for the two-lines test reports such line, see Rogier's plots above). But these lines do not allow testing holistic data properties, such as whether a relationship is u-shaped. In addition, these models require that researchers set arbitrary parameters such as how much to smooth the data; one arbitrary choice of smoothing may lead to an apparent u-shape while another choice not. Flexible models are seldom the right choice for hypothesis testing.
4. Shouldn't one force the two lines to meet? Surely there is no discontinuity in the true model.
No. It is imperative that the two lines be allowed not to meet. To run an "interrupted" rather than a "segmented" regression. This goes back to Question 3. We are not trying to fit the data overall as well as possible, but merely to compute an average slope within a set of x-values. If you don't allow the two lines to be interrupted, you are no longer computing two separate means and can have a very high false-positive rate detecting u-shapes (see example .png).
Footnotes.
- At least three papers have proposed a slightly more sophisticated test of u-shapedness relying on quadratic regression (Lind & Mehlum .htm | Miller et al. htm| Spiller et al .htm). All three propose, actually, a mathematically equivalent solution, and that solution is only valid if the true relationship is quadratic (and not, for example, y=log(x) ). This assumption is strong, unjustified, and untestable, and if it is not met, the results are invalid. When I showcase the quadratic regression performing terribly in this post, I am relying on this more sophisticated test. The more commonly used test, simply looking if b is significant, fares worse. [↩]
- The reason for the poor performance is that quadratic regressions assume the true relationships is, well, quadratic, and if it is is not, and why would it be, anything can happen. This is in contrast to linear regression, which assumes linearity but if linearity is not met, the linear regression is nevertheless interpretable as the unbiased estimate of the average slope. [↩]
- The two lines are estimated within a single interrupted regression for greater efficiency [↩]

