Diederik Stapel, Dirk Smeesters, and Lawrence Sanna published psychology papers with fake data. They each faked in their own idiosyncratic way, nevertheless, their data do share something in common. Real data are noisy. Theirs aren't.
Gregor Mendel's data also lack noise (yes, famous peas-experimenter Mendel). Moreover, in a mathematical sense, his data are just as lacking in noise. And yet, while there is no reasonable doubt that Stapel, Smeesters, and Sanna all faked, there is that Mendel did. Why? Why does the same statistical anomaly make a compelling case against the psychologists but not Mendel?
Because Mendel, unlike the psychologists, had a motive. Mendel's motive is his alibi.
Excessive similarity
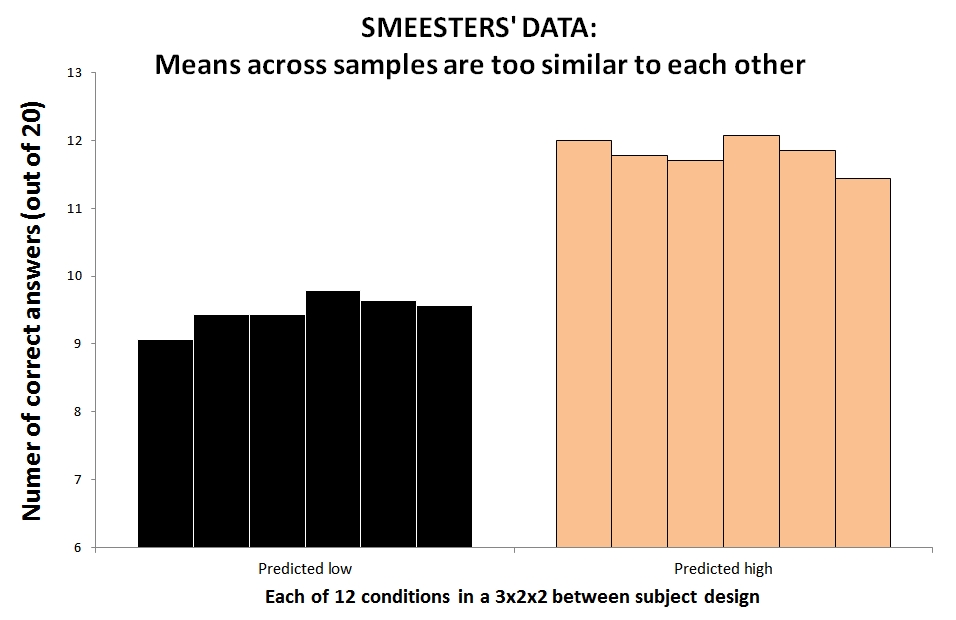
To get a sense for what we are talking about, let's look at the study that first suggested Smeesters was a fabricateur. Twelve groups of participants answered multiple-choice questions. Six were predicted to do well, six poorly. 
(See retracted paper .html)
Results are as predicted. The lows, however, are too similarly low. Same with highs. In "Just Post It" (SSRN), I computed this level of lack of noise had ~21/100000 chance if the data were real (additional analyses lower the odds to miniscule).
Stapel and Sanna had data with the same problem. Results too similar to be true. Even if population means were identical, samples have sampling error. Lack of sampling error suggests lack of sampling.
How Mendel is like Stapel, Smeesters & Sanna
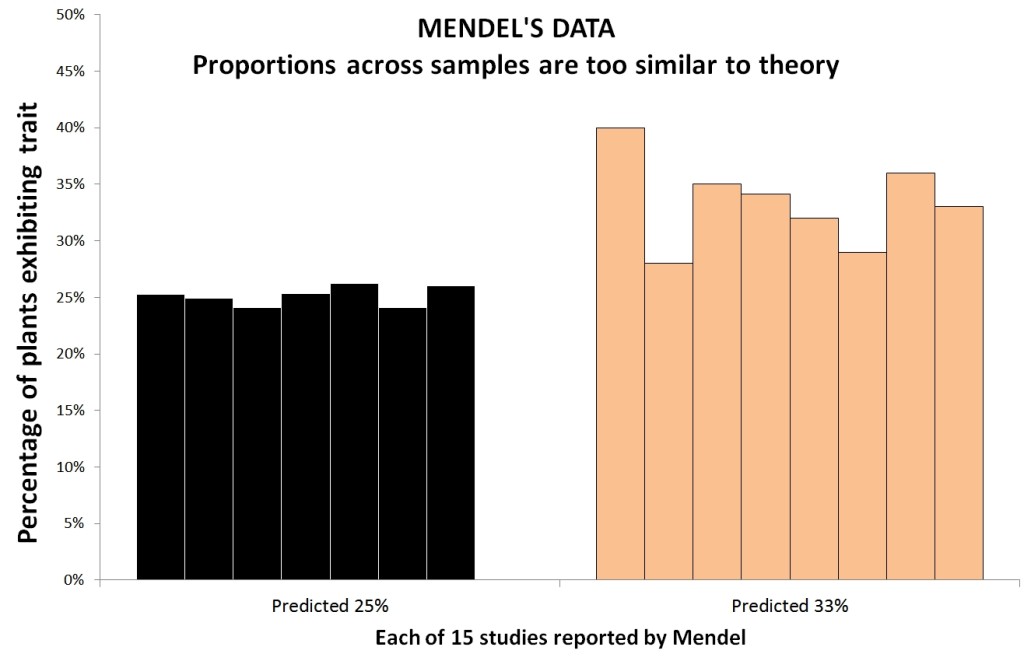
Mendel famously crossed plants and observed the share of baby-plants with a given trait. Sometimes he predicted 1/3 would show it, sometimes 1/4. He was, of course, right. The problem, first noted by Ronald Fisher in 1911 (yes, p-value co-inventor Fisher) is that Mendel's data also, unlike real data, lacked sampling error. His data were too-close to his predictions.
Recall how Smeesters' data had 27/100000 chance if data were real?
Well, Gregor Mendels' data had 7/100000 chance (See Fisher's 1936 paper .pdf; especially Table V).
How Mendel is not like Stapel, Smeesters, Sanna
Mendel wanted his data to look like his theory. He had a motive for lacking noise. It made his theory look better.
Imagine Mendel runs an experiment and gets 27% instead of 33% of baby-plants with a trait. He may toss out a plant or two, he may re-run the experiment; he may p-hack. This introduces reasonable doubt. P-hacking is an alternative explanation for Mendel's anomalous data. (See e.g., Pires & Branco's 2010 paper suggesting Mendel p-hacked, .pdf).
Sanna, Smeesters and Stapel, in contrast lack a motive. The similarity is unrelated to their hypotheses. P-hacking to get their results does not explain the degenerate results they get.
One way to think of this is that Mendel's theory was rich enough to make point predictions, and his data are too similar to these. Psychologists seldom make point predictions, the fabricaterus had their means too similar to each other, not to theory.
Smeesters, for instance, did not need the low conditions to be similar to each other, just to be different from the high so p-hacking wouldn't get his data to lack noise [1]. Worse. p-hacking makes Smeesters' data look more aberrant.
Before resigning his tenured position, Smeesters told the committee investigating him, that he merely dropped extreme observations aiming for better results. If this were true, if he had p-hacked that way, his low-means would look too different from each other, not too similar [2].
If Mendel p-hacked, his data would look the way they look.
If Smeesters p-hacked, his data would look the opposite of the way they look.
This gives reasonable doubt to Mendel being a fabricateur, and eliminates reasonable doubt for Smeesters.
CODA: Stapel's dissertation
Contradicting the committee that investigated him, Stapel has indicated that he did not fake his dissertation (e.g., in this NYTimes story .html).
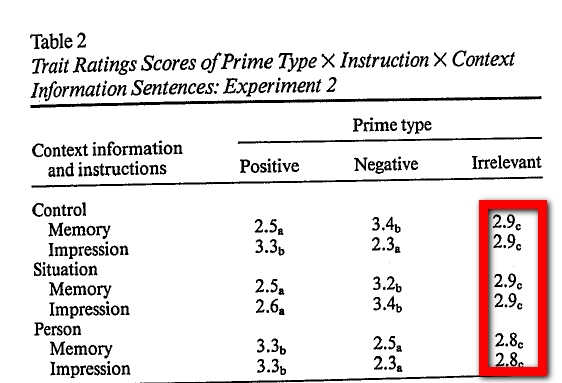
Check out this table from a (retracted) paper based on that dissertation (.html).
These are means from a between subject design with n<20 per cell. Such small samples produce so much noise as to make it very unlikely to observe means this similar to each other.
Most if not all studies in his dissertation look this way.
- Generic file-drawering of n.s. results will make means appear slightly surprisingly similar among the significant subset. But, not enough to raise red flags (see R code). Also, it will not explain the other anomalies in Smeesters data (e.g., lack of round numbers, negative correlations in valuations of similar items). [↩]
- See details in the Nonexplanations section of "Just Post It", SSRN [↩]

