
As described in our previous post (.htm), back in 2006 [email protected] sent three Excel spreadsheets, each “last saved” by user “Dan Ariely”, to then-PhD-student-but-now-full-professor Kyle Hyndman. Those spreadsheets contained the data required to reproduce the results reported in Ariely and Wertenbroch’s (2002) influential article on deadlines and procrastination.
In our previous post, we reported data anomalies in the Study 2 spreadsheet. In this post, we present analyses of the Study 1 spreadsheet. The data are very different, the forensic analyses are very different, but our conclusions are very similar.
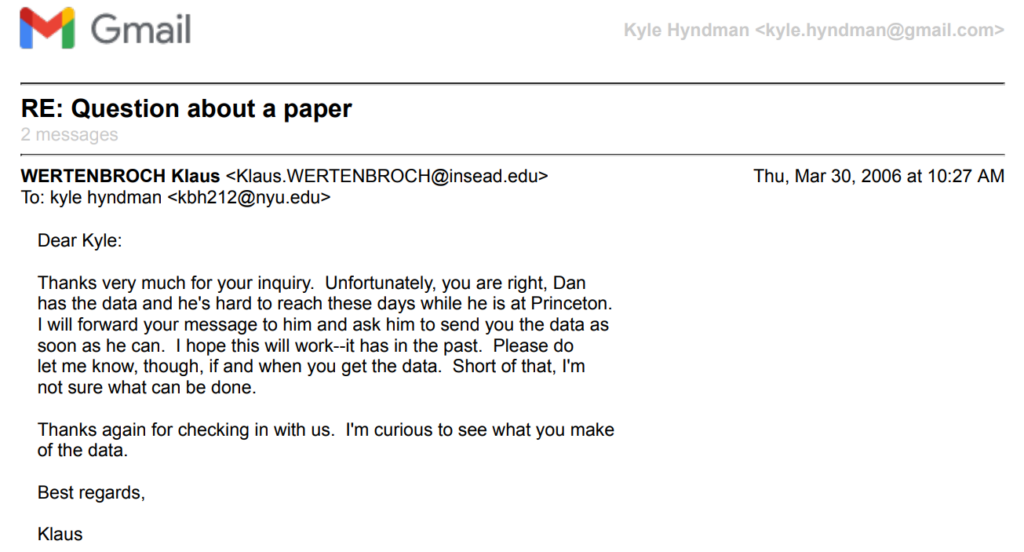
As we indicated in our previous post, to the best of our knowledge, Klaus Wertenbroch never had access to any version of the data for any of the studies. And, we believe it is thanks to him that we do. When Kyle Hyndman reached out to the authors back in 2006, Klaus replied with this email (Klaus gave us permission to include this email in our posts):
Our ResearchBox contains the data and code to reproduce all of the results in both posts.
Study 1
In Study 1, the authors compared students’ performance in two sections of the same MIT executive education course. In both sections, students were required to write three short papers over the course of the semester. In the Evenly Spaced Deadlines section, the papers were due every four weeks, whereas in the Set Your Own Deadlines section, each student set their own due dates at the beginning of the semester and then were expected to meet those deadlines as the semester progressed. In both sections, submissions incurred a 1% penalty for every day they were turned in after the deadline.
The authors’ key hypothesis was that evenly spaced deadlines help counter procrastination. In the extreme, if everything is due on the last day, people wait too long to do everything, they have insufficient time to do all three papers at once, and their performance suffers. That’s the idea.
The authors present three key findings:
Finding #1: Students who set their own deadlines did not always evenly space them.
Finding #2: Grades in the Set Your Own Deadlines section were significantly lower than grades in the Evenly Spaced Deadlines section.
Finding #3: Within the Set Your Own Deadlines section, students who chose to spread out their deadlines performed better than those who did not. Indeed, the grade gap between those students and the Evenly Spaced Deadlines section was reportedly “reduced by 59%” (p. 222) [1].
Finding #3 is especially critical to this post.
The Original Data
The first step to understanding what happened in this study is to orient to the data. Here is a screenshot of the spreadsheet, formatted to make it easier to digest:
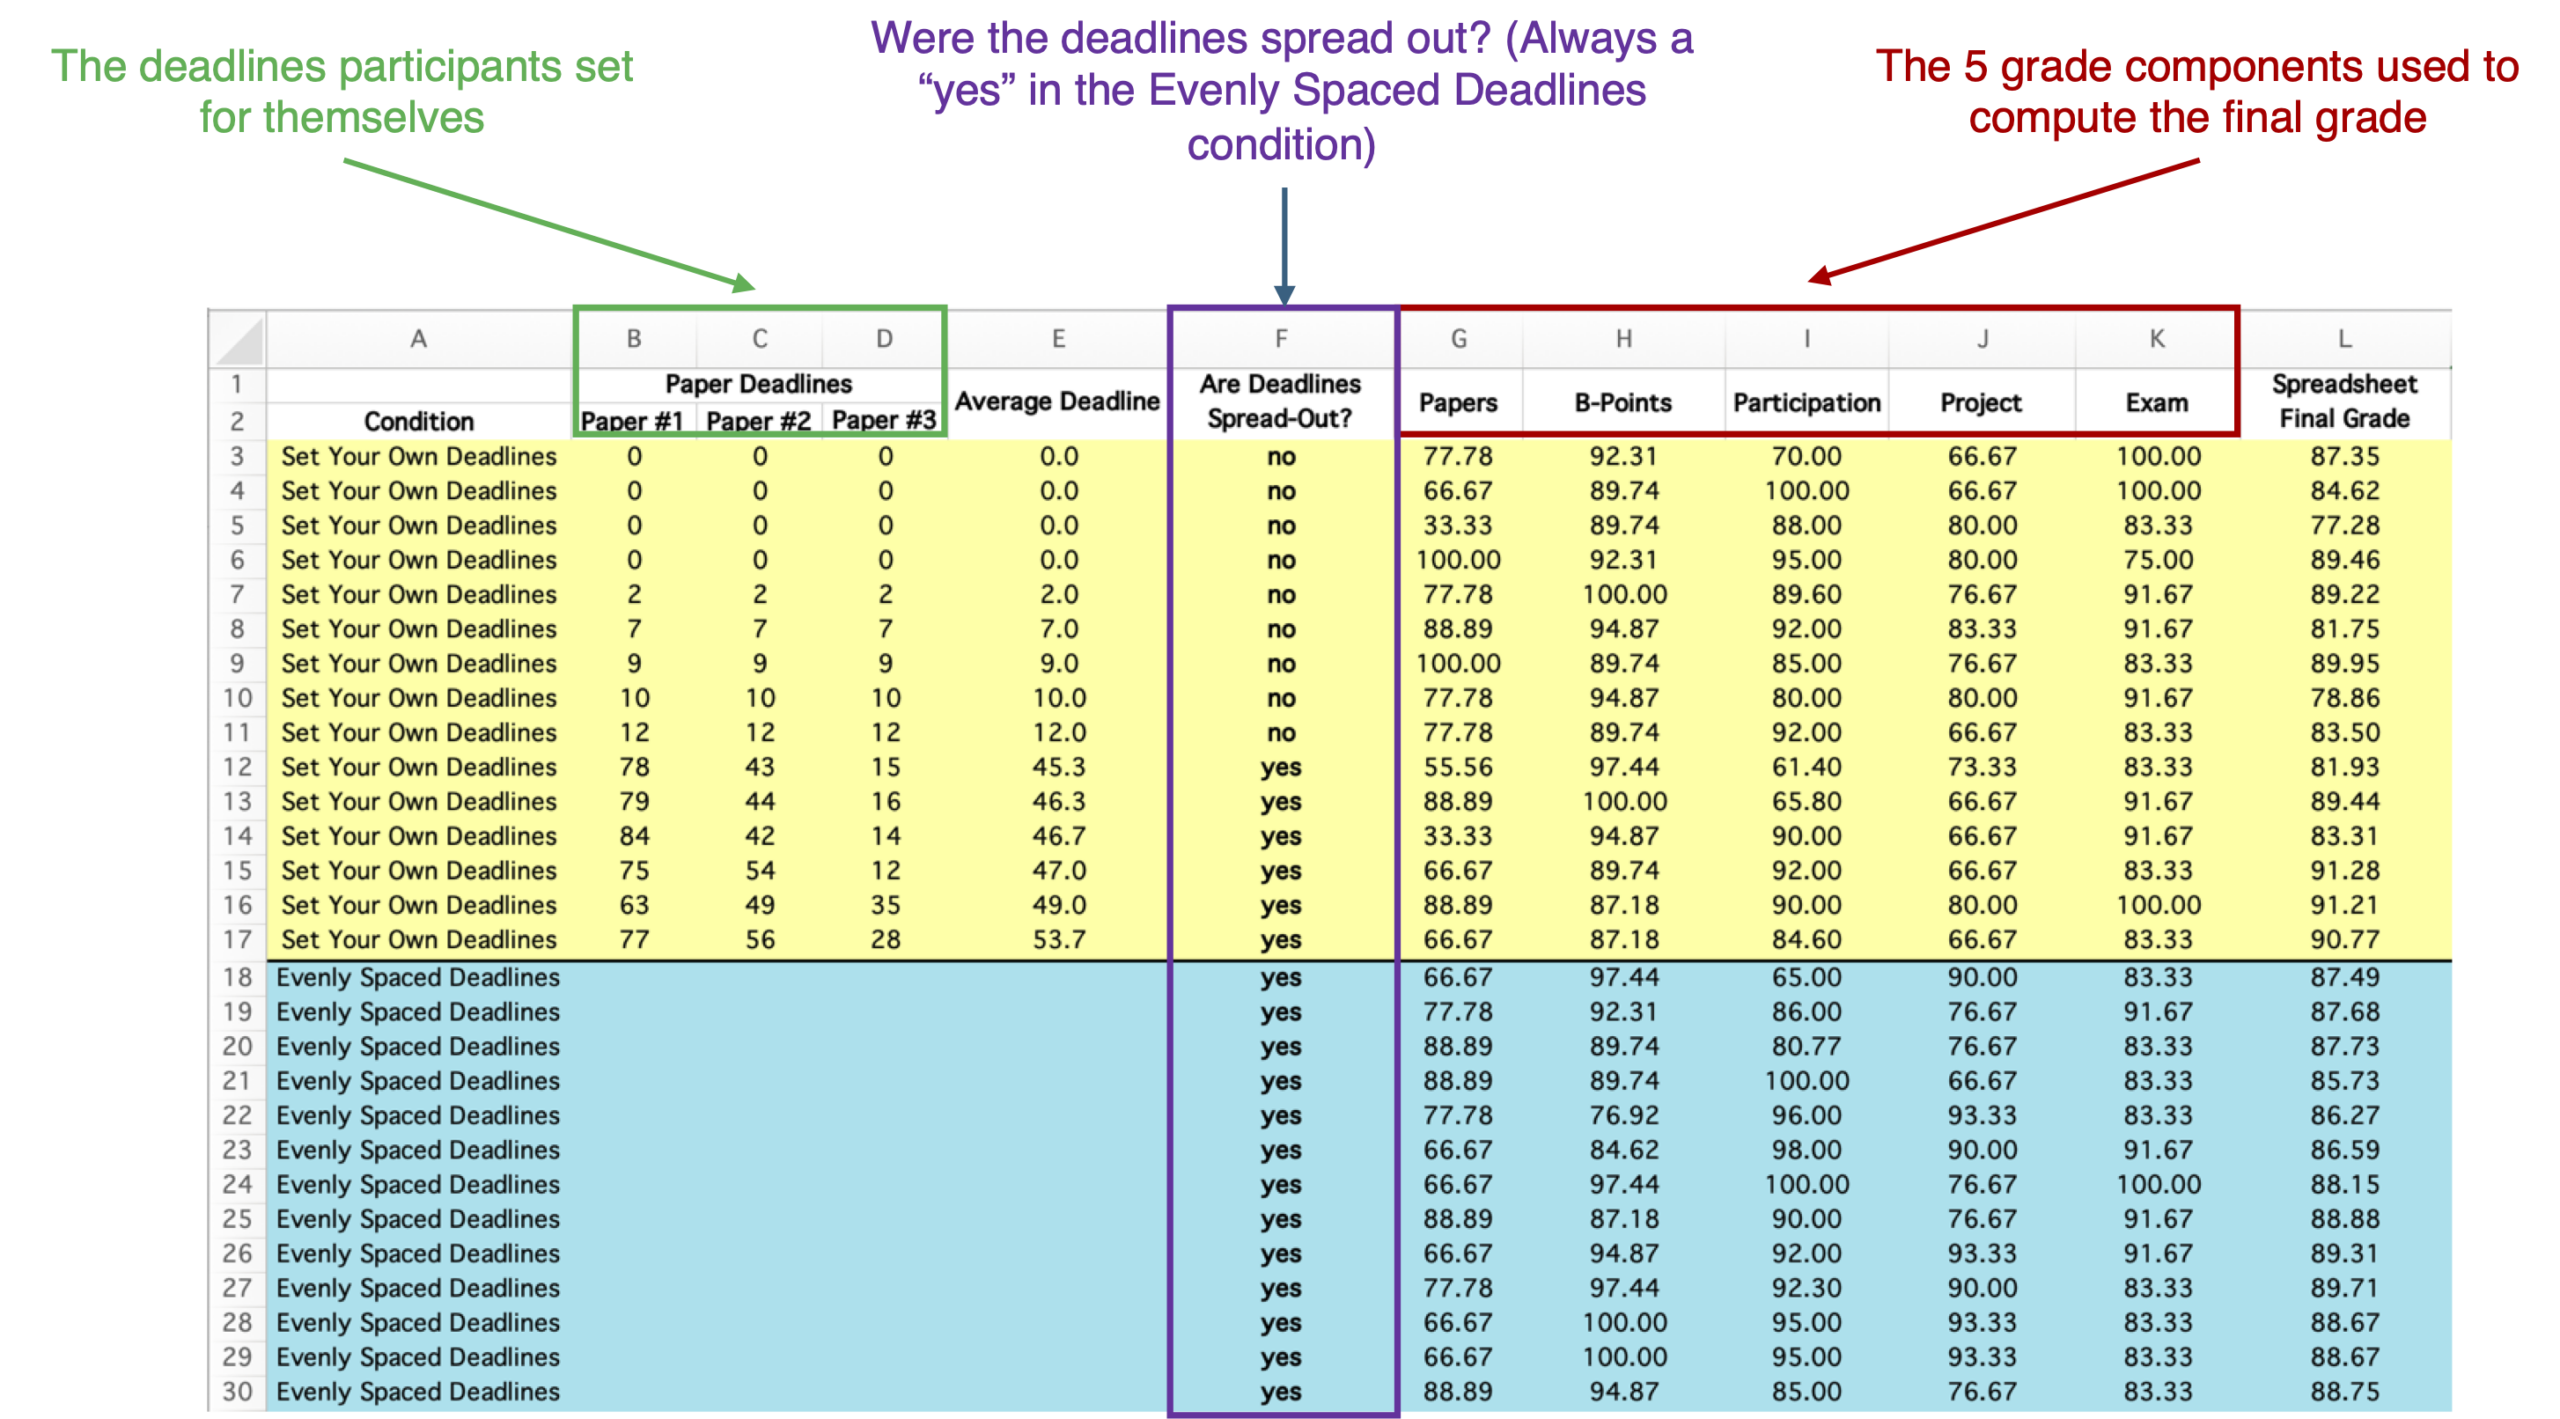 Fig 1. Screenshot of the Study 1 Spreadsheet
Note: For clarity, we show only a subset of rows, with renamed and reordered columns, rounded numbers, and added color.
Columns B-D show us the deadlines that participants set for themselves in the Set your Own Deadline condition, measured in days until the last class. For instance, “0, 0, 0” means that they made all papers due on the last day, and “12, 12, 12” means they made all papers due 12 days before the last day of class.
Column F is of critical importance to this post. This variable, which was included in the original spreadsheet, indicates whether the deadlines were spread out over different days (“yes”) or whether they were all set on the same day (“no”). In the Evenly Spaced Deadlines section, all deadlines were forcibly spaced by the professor, and so all rows are a “yes.” In the Set Your Own Deadlines section, some are “yes” and some are “no” (This variable is incorrectly described in the paper; see footnote [2]).
The next five columns, G-K, are the component grades on which the final grade, Column L, is based. Those graded components include (1) the three short papers, (2) whatever “B-Points” were, (3) participation, (4) a final project, and (5) the exam.
Using that “Spreadsheet Final Grade” column (L), we successfully reproduce all the Study 1 results reported in the published paper, confirming to our satisfaction that we have the original data. See Appendix 1 (.pdf).
How Was “Final Grade” Computed?
Because the failed replication focused on Study 2 (see our previous post), we weren’t originally planning to closely examine the Study 1 data. But we decided to take a look, and, in an effort to understand the data file, we tried to figure out how the final grades were computed. Specifically, how were the five grade components (e.g., participation, final exam) combined to generate the final grade?
We expected this to be straightforward, but simple intuition and trial-and-error wasn’t giving us the answer. And so we resorted to an old-school AI method: linear regression. We set the dataset’s final grade as the dependent variable and the five component grades as the predictors. The coefficients tell us the average effect of each component on the final grade. Because final grades should be perfectly predicted by the grade components, we should get an R2 of 100%. Instead we got an R2 of 56.5%:
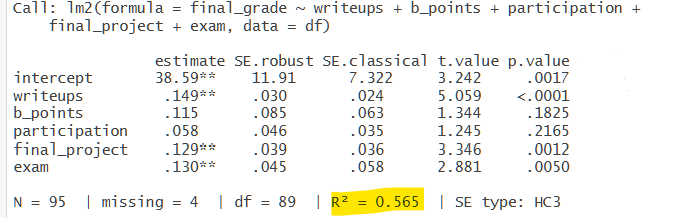 Fig 2. Regression predicting final grades with component grades
Huh.
So only about half the variance in final grades comes from the five grade components. Where does the other half come from? There are some benign possibilities. For example, perhaps the instructor exercised discretion when setting final grades, discretion not documented in the spreadsheet. Or perhaps final grade was computed with a nonlinear combination of component grades. Or perhaps the data file got partially scrambled somehow (an innocent error that has twice happened to one of the authors of this post). By itself, an R2 below 100% is a red flag, but it does not necessarily imply anything sinister.
An additional possibility, also potentially benign (though odd), is that perhaps the two sections used different rules to compute final grades (e.g., maybe final project mattered 35% in one section and only 25% in the other). That is easy to test, as you just need to run the same regression separately for each section. So we did that, thinking that maybe now we’d see some perfect 100% R2s. Well, we did, but only for one of the two sections.
In the Evenly Spaced Deadlines section, we see this:
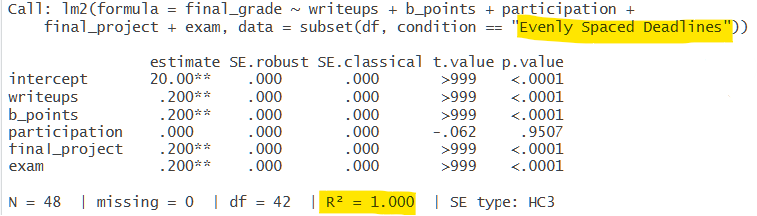 Fig 3. Regression predicting final grades with component grades (Evenly Spaced Deadlines section).
These results make perfect sense. Four of the coefficients are .2, meaning that those four components were equally weighted. The fifth component, “participation”, had a weight of 0, implying that though this element was recorded, it did not contribute at all to the final grade. Furthermore, because the intercept is 20, and all grades are on a 0 to 100 scale, all students were graded as if they had 100% in participation. So, in this section, the final grade is the simple average of the five individual component grades, once you give everyone a 100% in participation. This is simple and sensible.
Results in the Set Your Own Deadlines section are less simple. In fact, they are a bit of a nightmare:
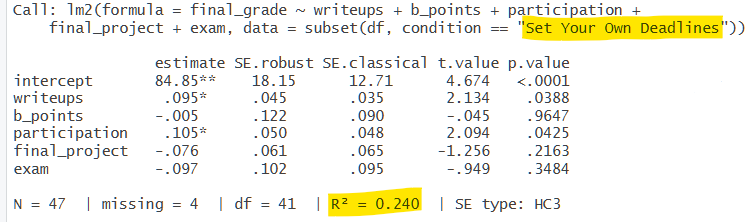 Fig 4. Regression predicting final grades with component grades (Set Your Own Deadlines section).
Not only is the R2 way lower than 100%, but three of the coefficients are negative. The higher the student’s exam grade, the lower their final grade? As folks on the internet might say, WTAF?
We think the answer to that question is: data fraud.
Evidence of Data Alterations in the Set Your Own Deadlines Condition
OK, so in one section grades are a simple average and in the other we don’t know what’s going on. To try to figure it out, we went back and regraded every student in the Set Your Own Deadlines section, relying on the exact same rule from the Evenly Spaced Deadlines section: first giving everyone a 100% participation grade, and then averaging all five component grades. We call this the “re-computed Final Grade”.
So we now have for each student a “spreadsheet final grade” and a “re-computed final grade”. We calculated the difference between them and plotted it. We had absolutely no idea what that would look like. It looked like this:
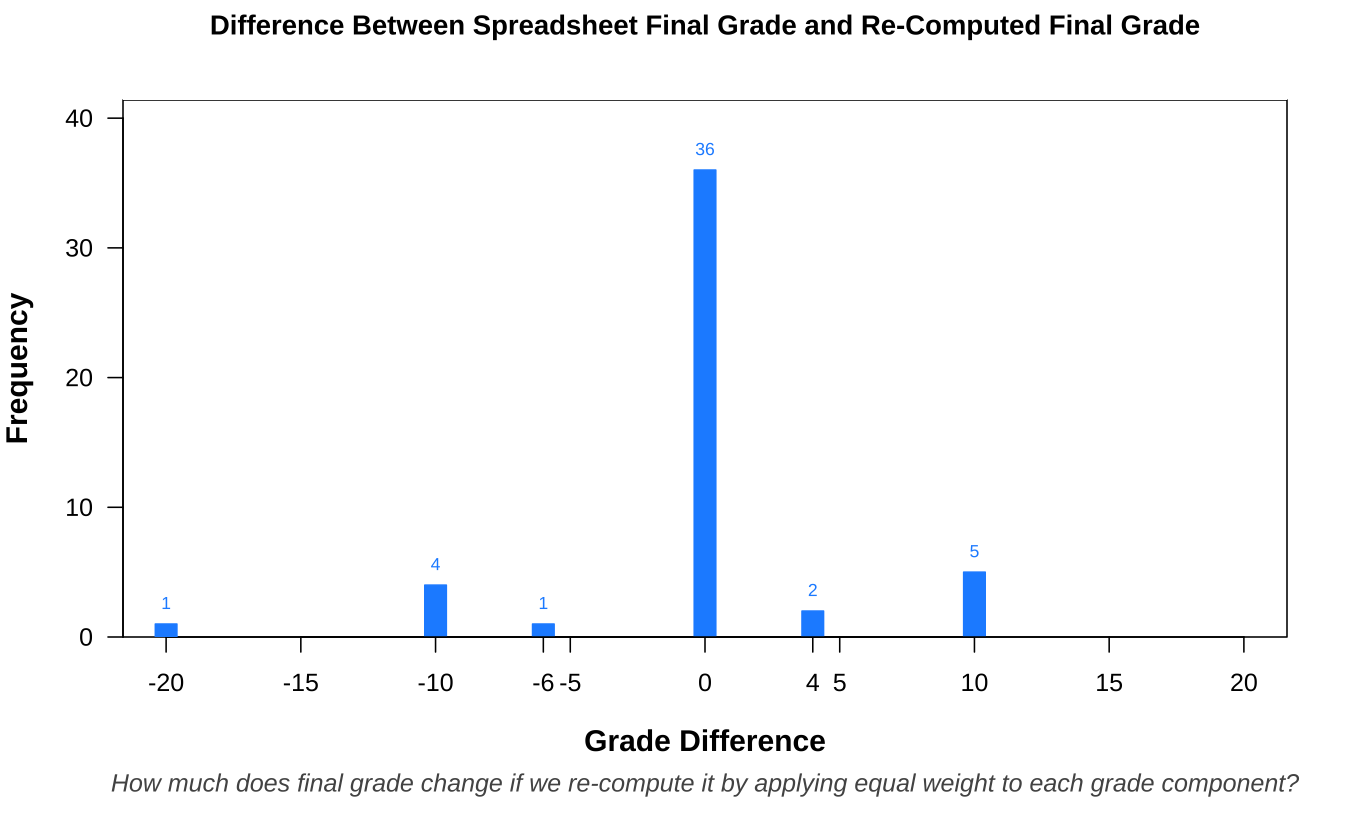 Fig 5. Difference between final grade in the spreadsheet and the re-computed final grade generated by averaging the five component grades.
This figure tells us two important things.
First, for most students (36 out of 49), the spreadsheet final grade in the Set Your Own Deadlines section was exactly the same as the re-computed final grade (i.e., the difference score was zero). This strongly suggests that the same simple grading rule was originally used in both sections.
Second, for the remaining 13 students, all deviations from this simple grading rule were integers (i.e., exactly -20, -10, -6, +4, and +10). This suggests that final grades weren’t different because of how the component grades were weighted. It suggests that the final grades were edited manually.
Evidence That The Final Grade Alterations Were Intentional
If final grades were intentionally altered, then they were presumably altered with a purpose, likely to provide (false) evidence for one of the authors’ hypotheses. And, indeed, without the 13 grade alterations, there is no Finding #3.
Finding #3, remember, was that students who chose to spread out their deadlines performed better than those who didn’t, and similarly to those in the Evenly Spaced Deadlines section.
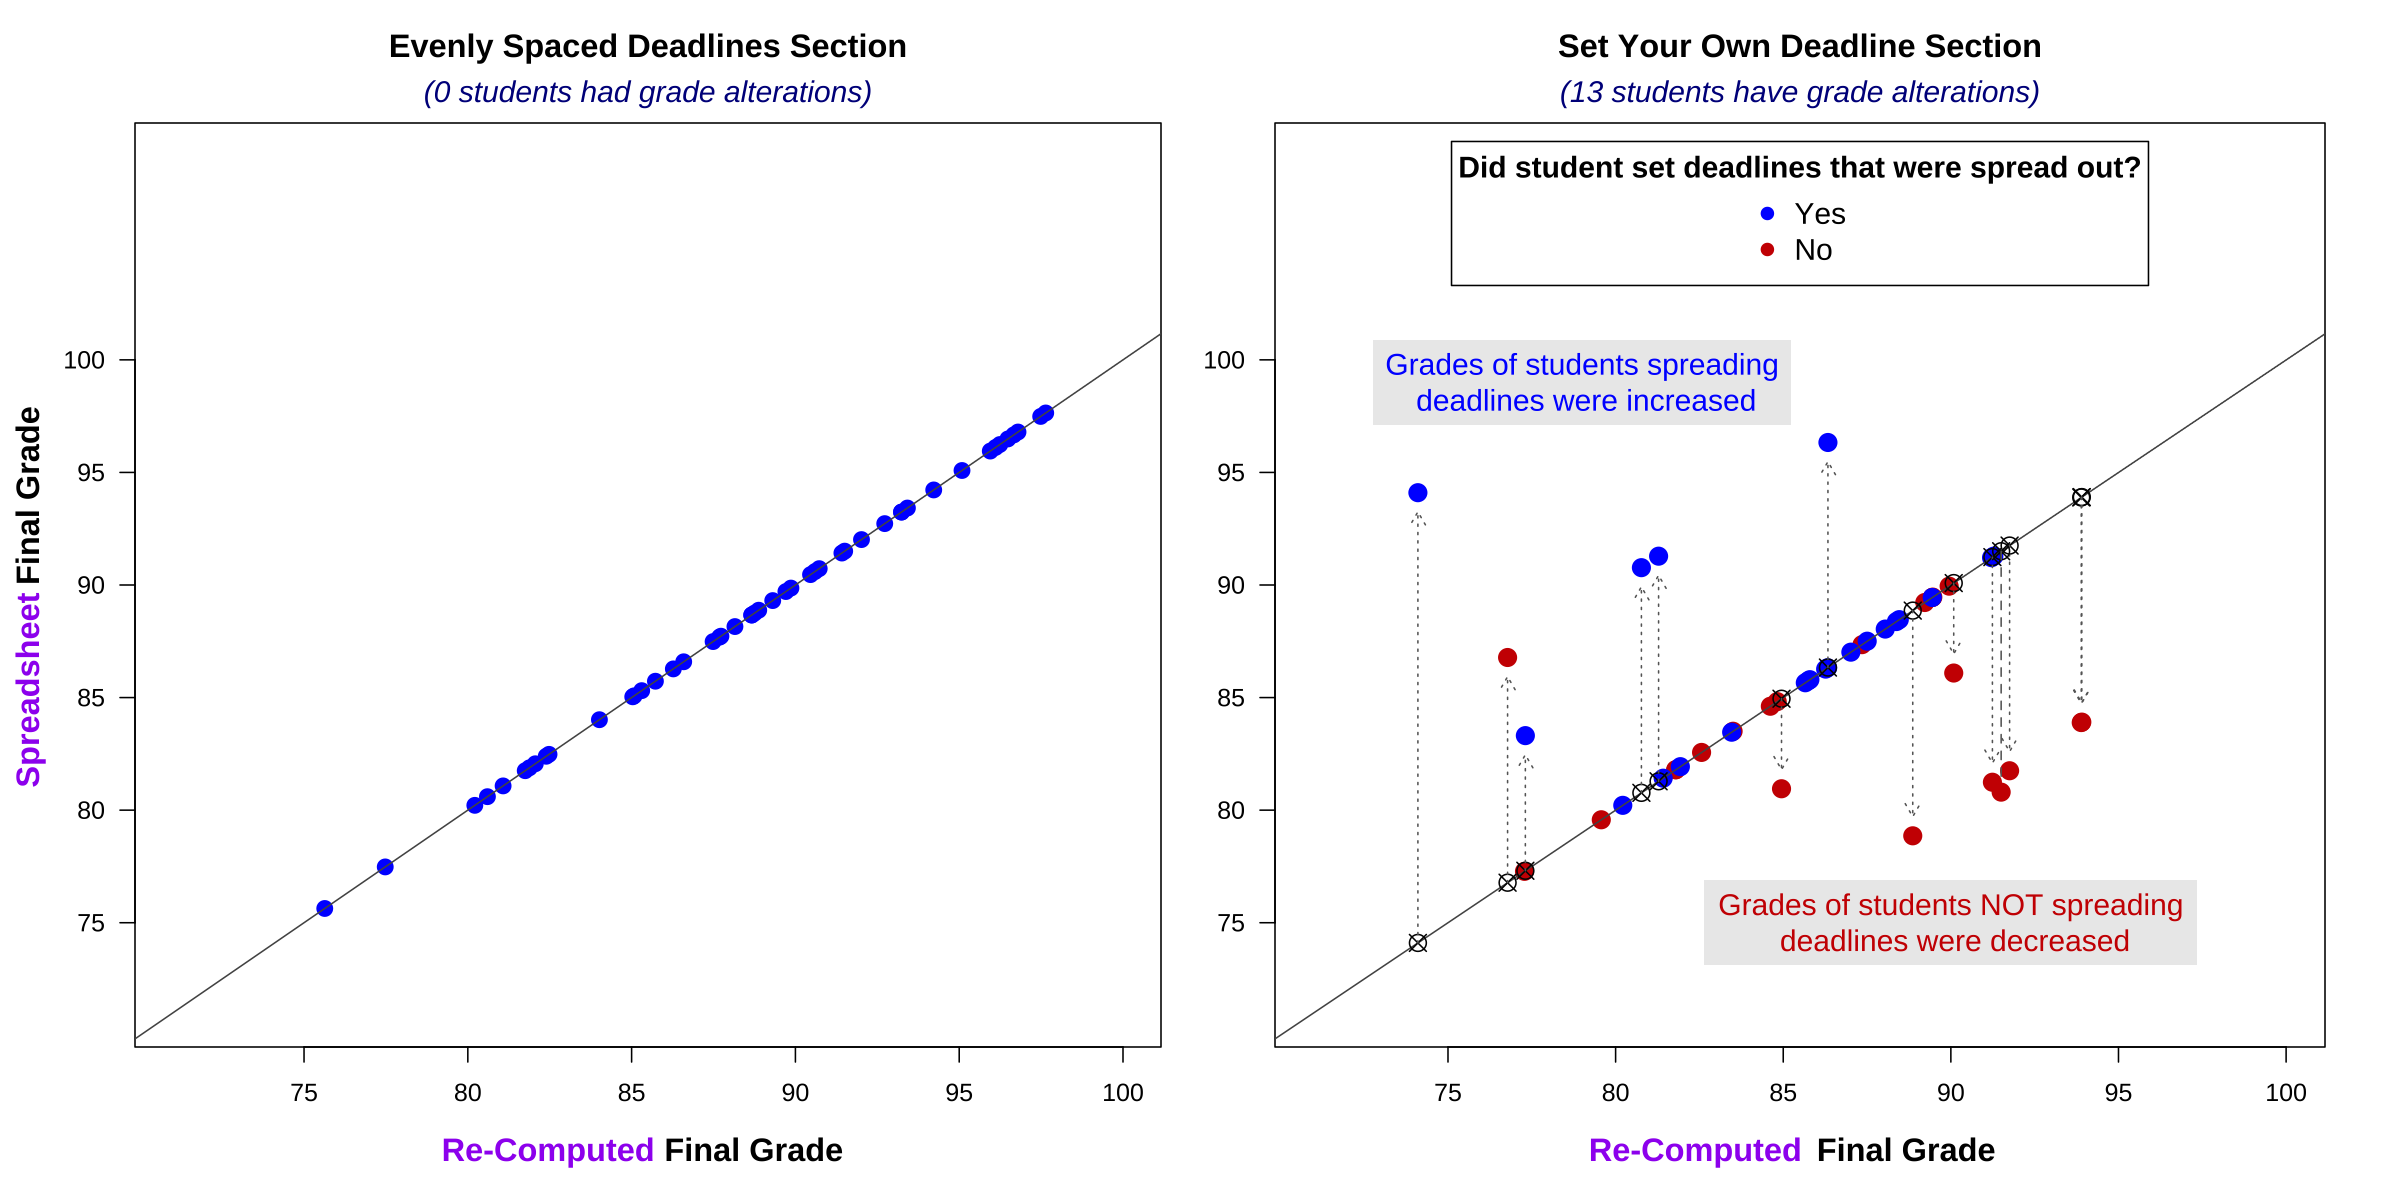
To understand the evidence we are about to show, let’s imagine that Finding #3 were not supported in the original data: that students who spread their deadlines did just as well as, or worse than, students who did not spread their deadlines. And imagine you were tasked with tampering with the data to produce Finding #3. What would you have to do? You would need to increase the grades of students who did spread out their deadlines and/or decrease the grades of those who did not. Figure 6 shows that that’s exactly how the grades were altered:
Fig 6. Re-computed vs. Spreadsheet Final Grades
The x-axis shows the “re-computed final grade” – the simple average of the five component grades – and the y-axis shows the “spreadsheet final grade”. If the spreadsheet grade was computed using the simple average rule, the data would fall on the diagonal (45-degree) line.
The left panel shows that this is the case for every student in the Evenly Spaced Deadlines section. In the right panel we see the 13 observations with altered grades. And, critically, 12 of these were in the direction of the authors’ hypothesis that spreading deadlines improves grades
All of the grades that were re-computed to be lower were from students who did not spread their deadlines (red dots), and 5 of the 6 that were re-computed to be higher were from students who did spread their deadlines (blue dots).
As mentioned, without these 13 alterations Finding #3 disappears [3].
An interesting fact is that these data alterations, all in the Set Your Own Deadline section, somehow did not at all influence the overall average grade of that section. The average final grade in the spreadsheet is 85.67 and the average recomputed final grade is 85.67. So the data tamperer altered the data in a way that got the new result they wanted while preserving the original mean. Why would someone do that?
Mr. Green In The Ballroom With The Candlestick
When reading the paper closely, we got the sense that Finding #3 was being presented without full conviction, the way authors reluctantly report results reviewers requested. For example, the authors motivate Finding #3 by writing, “it is possible that students in the [Set Your Own Deadlines] condition treated their deadlines as less binding” (p. 222), while saying in Footnote 3 why they don’t think that’s likely: “Evidence against this argument is that all students (in both sections) handed in their papers on or before the deadlines” (p. 222).
This led us to suspect that Finding #3 had been added to the paper in response to reviewers. And that made us wish that we could see an earlier version of the paper, one that was written before the authors responded to reviewers.
To our surprise, we found an earlier version of the paper posted to the INSEAD Working Paper Series back in 2001 (.htm) with a title page indicating that it was “Under review at Psychological Science”.
Interestingly, the earlier paper differed from the published paper in two important ways [4].
First, as we had suspected, the earlier paper did not include Finding #3.
Second, although the condition means reported in the earlier vs. published manuscripts were, to two decimal places, exactly the same (i.e., in both versions it was 85.67 in the Set Your Own Deadlines condition), the t-tests comparing those means generated different results:
In the published paper, the t-test was reported as: t(97) = 3.03.
In the earlier version of the paper, it was reported as: t(95) = 2.92.
(In about 30 seconds, we will explain why the degrees of freedom – 95 vs. 97 – are different.)
Why should you care about these small differences in t-values between two versions of a 25-year-old manuscript? Because they have big forensic value. And that’s because we can reproduce both results. Specifically:
When we run the t-test with the spreadsheet final grades, we get the published paper’s result: t(97) = 3.03.
When we run the t-test with the re-computed final grades, we get the earlier paper’s result: t(95) = 2.92.
(As promised 30 seconds ago, this footnote explains why the degrees of freedom are not identical: [5]).
Our ability to reproduce the t(95) = 2.92 with the re-computed grades is critical. It shows that when we reverse the grades back to what we think they were prior to the falsification, we get the exact same results that the authors reported in the earlier version of their manuscript. This proves that:
- Our re-computed grades are the ones used in the earlier version of the paper.
- The data were altered after the paper was first submitted to Psychological Science.

So Here’s What We Think Happened
In the original manuscript, the authors reported that the Evenly Spaced Deadlines section did better than the Set Your Own Deadlines section. Because this could occur for many reasons, someone on the review team asked the authors to demonstrate that the deadlines were the driving force. One way to do that is to show that students who set evenly-spaced deadlines did as well as those assigned evenly-spaced deadlines.
But when that analysis was run, it didn’t work. To make it work, some of the final grades had to be altered. The person doing the altering wanted to achieve two things at once: (1) generate the desired result, while (2) preserving the condition means, so that those means did not differ between the two versions of the manuscript. And so that is what they did. They altered the data while preserving the means. Now, that is not an easy thing to do, and so perhaps one of the 13 alterations had to go in the wrong direction, simply to get the means right. The authors now had reportable evidence that the differences in performance were due to the different deadlines rather than to something else.
The result? The publication of a paper that has had widespread (and continued) influence within the behavioral sciences.
(Kind of Amazing) Post-script:
After drafting this post, we reached out to the original authors, first to Wertenbroch and then to Ariely. Their responses appear in the blue text at the end of this post, but we want to highlight something separate and kind of astonishing. Wertenbroch asked if he could provide us with anything useful, and we asked whether he had his reviews from 2001. To our surprise he did. And he immediately sent them to us [6]. (We did some fact-checking of the reviews’ authenticity; see Appendix 2 pdf).
Before reporting on what they said, it is worth absorbing how remarkable that is. This was a time when reviewing was done by mail (e.g., the editor’s letter ends with a reminder to send four copies of the manuscript), and there are very few floppy disks, hard drives, or servers from 2001 that have survived to the present. Opening these reviews was like opening a time capsule to a different era.
So what was in that time capsule? Well, “Reviewer B” says, “you need to… show that the people who imposed deadlines similar to those imposed by the experimenter did about as well as the people who had deadlines imposed by the experimenter.” That request was echoed by the editor. The response to that request was the introduction of Finding #3, the source of the data alterations detailed in this post. And so we have direct evidence that, yes, in fact, this falsified analysis was conducted and included as a response to a request from reviewers.

We reprint here the author feedback that we showed in our previous post
About 6 weeks ago, on July 20th, 2026, we shared drafts of our posts with the original authors (Dan Ariely and Klaus Wertenbroch), the replication authors (Kyle Hyndman and Alberto Bisin), and the editor-in-chief of Psychological Science (Simine Vazire).
Klaus Wertenbroch sent us a response (PDF) in which he begins by thanking Hyndman and Bisin for having done the replication and us for having written these posts. He restates that he never had access to the data for any of the studies. He distinguishes between demand for precommitment, a finding that was replicated by Hyndman and Bisin and which is consistent with earlier work by him and others, and the effectiveness of such precommitments in these specific studies, which did not replicate. And he indicated that he has asked the editor to retract the paper.
You can read his response in full (PDF).
Dan Ariely did not reply to any of the three emails we sent him. But on August 7th, he wrote on LinkedIn (htm) and on his personal website (htm): “. . . Recently, I was made aware that data underlying a 2002 paper about deadlines and procrastination that I co-authored contained serious anomalies. The documentary record I have at my disposal today about those experiments isn’t sufficient to answer the questions that have been raised, and more than two decades, and hundreds of experiments later, my memory is similarly insufficient. Moving forward, my responsibility lies in ensuring accuracy – in updating the record on these experiments and, along with my co-author, cooperating with the journal that first published our paper to support their reviews and retraction processes.”
Neither LinkedIn nor Dan’s website allowed archive.org to save copies; so we screen recorded both pages (mp4).
Kyle Hyndman and Alberto Bisin asked us to include this statement: “As stated in the posts, in April 2006, we received three data files attached to an email sent from Dan Ariely’s MIT email account, with no stated restrictions on their use. In August 2023, we provided those files to Uri Simonsohn, Joe Simmons and Leif Nelson to obtain their professional assessment. We did not participate in Data Colada’s analysis or in drafting the posts. Our independent replication relies on newly collected data and stands on its own methodological findings. Questions concerning the provenance or integrity of the historical files should be addressed by Data Colada, Dan Ariely, and the institutions with appropriate responsibility for those questions.”
Simine Vazire indicated that she is only allowed to say that Psychological Science is considering “best next steps regarding the 2002 paper in accordance with COPE guidelines.”
Footnotes.
- This supports the notion “that the overall effect of self-imposing deadlines was due primarily to the timing of the deadlines, not just a weaker perceived potency of self-imposed deadlines” (p. 222).[↩]
- The “Are Deadlines Spread-Out?” variable is erroneously reported in the paper
In the original dataset, this column is called “Rational?” We perfectly reproduce the Finding #3 results with it, indicating that it is indeed the variable used as an indicator of whether participants faced evenly spaced deadlines.
This variable is not accurately described in the published paper. For some reason, in the original spreadsheet this variable does not capture whether participants spread out their deadlines, but instead, whether the *average delay* was greater than some cutoff value (it appears to be 30). For example, whereas a person who set deadlines of 9, 9, 9 was (sensibly) given a 0 on this variable – meaning not evenly spaced – a person who set a deadline of 70, 70, 70 was given a 1 on this variable – meaning evenly spaced. Similarly, whereas a person who set deadlines of 77, 42, and 14 was (sensibly) coded as having evenly spaced deadlines, a person who set deadlines of 28, 21, and 14 was coded as *not* having evenly spaced deadlines.[↩] - With the re-computed grades, students who voluntarily spread out their deadlines performed significantly worse (M = 84.91) than those who were given evenly spaced deadlines (M = 88.76), t(68) = 2.83, p = .006. The opposite of Finding #3.[↩]
- In the earlier paper, Study 1 was Study 2, and the published Pilot Study was Study 1.[↩]
- The spreadsheet contains 99 rows with a final grade, but only 97 rows with the values for all component grades. Thus, when recomputing the grade based on component grades, one loses two observations.[↩]
- The reviews he shared were Word documents of editorial decision letters across two rounds of review, presumably representing digital scans of the hard copies received in the mail. Both documents were last saved by user “Dan Ariely” and the decision letters are directed to him (“Dear Dr. Ariely”). For privacy considerations we have not made those documents public, as referee reports are written expecting confidentiality, and because we don’t have the reviewers’ identities we could not ask them to approve posting.[↩]