Data Colada
Menu
  • Home
  • About
  • Feedback Policy
  • Table of Contents
Menu

[61] Why p-curve excludes ps>.05


Posted on June 15, 2017October 30, 2017 by Uri Joe Leif

In a recent working paper, Carter et al (.pdf) proposed that one can better correct for publication bias by including not just p<.05 results, the way p-curve does, but also p>.05 results [1]. Their paper, currently under review, aimed to provide a comprehensive simulation study that compared a variety of bias-correction methods for meta-analysis.

Although the paper is well written and timely, the advice is problematic. Incorporating non-significant results into a tool designed to correct for publication bias requires one to make assumptions about how difficult it is to publish each possible non-significant result. For example, one has to make assumptions about how much more likely an author is to publish a p=.051 than a p=.076, or a p=.09 in the wrong direction than a p=.19 in the right direction, etc. If the assumptions are even slightly wrong, the tool’s performance becomes disastrous [2]

Assumptions and p>.05s
The desire to include p>.05 results in p-curve type analyses is understandable. Doing so would increase our sample sizes (of studies), rendering our estimates more precise. Moreover, we may be intrinsically interested in learning about studies that did not get to p<.05.

So why didn’t we do that when we developed p-curve? Because we wanted a tool that would work well in the real world.  We developed a good tool, because the perfect tool is unattainable.

While we know that the published literature generally does not discriminate among p<.05 results (e.g., p=.01 is not perceptibly easier to publish than is p=.02), we don’t know how much easier it is to publish some non-significant results rather than others.

The downside of p-curve focusing only on p<.05 is that p-curve can “only” tell us about the (large) subset of published results that are statistically significant. The upside is that p-curve actually works.

All p>.05 are not created equal
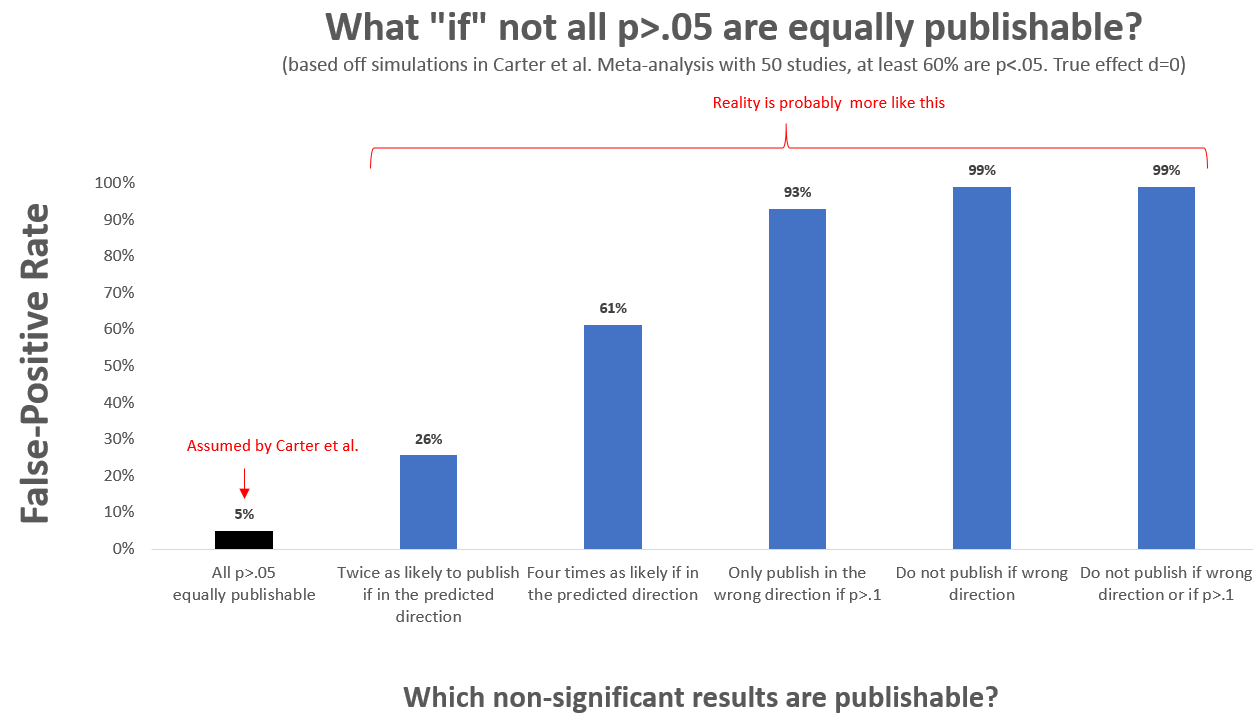
The simulations reported by Carter et al. assume that all p>.05 findings are equally likely to be published: a p=.051 in the right direction is as likely to be published as a p=.051 in the wrong direction. A p=.07 in the right direction is as likely to be published as a p=.97 in the right direction. If this does not sound implausible to you, we recommend re-reading this paragraph.

Intuitively it is easy to see how getting this assumption wrong will introduce bias. “Imagine” that a p=.06 is easier to publish than is a p=.76. A tool that assumes both results are equally likely to be published will be naively impressed when it sees many more p=.06s than p=.76s, and it will fallaciously conclude there is evidential value when there isn’t any.

A calibration
We ran simulations matching one of the setups considered by Carter et al., and assessed what happens if the publishability of p>.05 results deviated from their assumptions (R Code). The black bar in the figure below shows that if their fantastical assumption were true, the tool would do well, producing a false-positive rate of 5%. The other bars show that under some (slightly) more realistic circumstances, false-positives abound.

One must exclude p>.05
It is obviously not true that all p>.05s are equally publishable. But no alternative assumption is plausible. The mechanisms that influence the publication of p>.05 results are too unknowable, complex, and unstable from paper to paper, to allow one to make sensible assumptions or generate reasonable estimates. The probability of publication depends on the research question, on the authors’ and editors’ idiosyncratic beliefs and standards, on how strong other results in the paper are, on how important the finding is for the paper’s thesis, etc.  Moreover, comparing the 2nd and 3rd bar in the graph above, we see that even minor quantitative differences in a face-valid assumption make a huge difference.

P-curve is not perfect. But it makes minor and sensible assumptions, and is robust to realistic deviations from those assumptions. Specifically, it assumes that all p<.05 are equally publishable regardless of what exact p-value they have. This captures how most researchers perceive publication bias to occur (at least in psychology). Its inferences about evidential value are robust to relatively large deviations from this assumption (e.g., if researchers start aiming for p<.045 instead of p<.05, or even p<.035, or even p<.025, p-curve analysis, as implemented in the online app (.htm), will falsely conclude there is evidential value when the null is true, no more than 5% of the time.  See our “Better P-Curves” paper (SSRN)).

Conclusion
With p-curve we can determine whether a set of p<.05 results have evidential value, and what effect we may expect in a direct replication of those studies.  Those are not the only questions you may want to ask. For example, traditional meta-analysis tools ask what is the average effect of all of the studies that one could possibly run (whatever that means; see Colada[33]), not just those you observe. P-curve does not answer that question. Then again, no existing tool does. At least not even remotely accurately.

P-curve tells you “only” this: If I were to run these statistically significant studies again, what should I expect?

Wide logo


Author feedback.
We shared a draft of this post with Evan Carter, Felix Schönbrodt, Joe Hilgard and Will Gervais. We had an incredibly constructive and valuable discussion, sharing R Code back and forth and jointly editing segments of the post.

We made minor edits after posting responding to readers’ feedback. The original version is archived here .htm.

Subscribe to Blog via Email

Enter your email address to subscribe to this blog and receive notifications of new posts by email.


Footnotes.

  1. When applying p-curve to estimate effect size, it is extremely similar to following the “one-parameter-selection-model” by Hedges 1984 (.pdf). [↩]
  2. Their paper is nuanced in many sections, but their recommendations are not. For example, they write in the abstract, “we generally recommend that meta-analysis of data in psychology use the three-parameter selection model.” [↩]
  • Click to share on Facebook (Opens in new window)
  • Click to share on Twitter (Opens in new window)
  • Click to share on WhatsApp (Opens in new window)
  • More
  • Click to share on Pinterest (Opens in new window)
  • Click to share on Pocket (Opens in new window)
  • Click to share on LinkedIn (Opens in new window)
  • Click to share on Tumblr (Opens in new window)
  • Click to share on Reddit (Opens in new window)

Get email alerts

Join 2,231 other subscribers

Your hosts

Uri Simonsohn
Joe Simmons
Leif Nelson

Other Posts on Similar Topics

p-curve
  • [66] Outliers: Evaluating A New P-Curve Of Power Poses
  • [61] Why p-curve excludes ps>.05
  • [60] Forthcoming in JPSP: A Non-Diagnostic Audit of Psychological Research
  • [59] PET-PEESE Is Not Like Homeopathy
  • [49] P-Curve Won’t Do Your Laundry, But Will Identify Replicable Findings
  • [45] Ambitious P-Hacking and P-Curve 4.0
  • [41] Falsely Reassuring: Analyses of ALL p-values
  • [37] Power Posing: Reassessing The Evidence Behind The Most Popular TED Talk
  • [24] P-curve vs. Excessive Significance Test

tweeter & facebook

We tweet new posts: @DataColada
And link to them on our Facebook page

search

All posts

  • [75] Intentionally Biased: People Purposely Don’t Ignore Information They “Should” Ignore
  • [74] In Press at Psychological Science: A New ‘Nudge’ Supported by Implausible Data
  • [73] Don’t Trust Internal Meta-Analysis
  • [72] Metacritic Has A (File-Drawer) Problem
  • [71] The (Surprising?) Shape of the File Drawer
  • [70] How Many Studies Have Not Been Run? Why We Still Think the Average Effect Does Not Exist
  • [69] Eight things I do to make my open research more findable and understandable
  • [68] Pilot-Dropping Backfires (So Daryl Bem Probably Did Not Do It)
  • [67] P-curve Handles Heterogeneity Just Fine
  • [66] Outliers: Evaluating A New P-Curve Of Power Poses
  • [65] Spotlight on Science Journalism: The Health Benefits of Volunteering
  • [64] How To Properly Preregister A Study
  • [63] “Many Labs” Overestimated The Importance of Hidden Moderators
  • [62] Two-lines: The First Valid Test of U-Shaped Relationships
  • [61] Why p-curve excludes ps>.05
  • [60] Forthcoming in JPSP: A Non-Diagnostic Audit of Psychological Research
  • [59] PET-PEESE Is Not Like Homeopathy
  • [58] The Funnel Plot is Invalid Because of This Crazy Assumption: r(n,d)=0
  • [57] Interactions in Logit Regressions: Why Positive May Mean Negative
  • [56] TWARKing: Test-Weighting After Results are Known
  • [55] The file-drawer problem is unfixable, and that’s OK
  • [54] The 90x75x50 heuristic: Noisy & Wasteful Sample Sizes In The “Social Science Replication Project”
  • [53] What I Want Our Field To Prioritize
  • [52] Menschplaining: Three Ideas for Civil Criticism
  • [51] Greg vs. Jamal: Why Didn’t Bertrand and Mullainathan (2004) Replicate?
  • [50] Teenagers in Bikinis: Interpreting Police-Shooting Data
  • [49] P-Curve Won’t Do Your Laundry, But Will Identify Replicable Findings
  • [48] P-hacked Hypotheses Are Deceivingly Robust
  • [47] Evaluating Replications: 40% Full ≠ 60% Empty
  • [46] Controlling the Weather
  • [45] Ambitious P-Hacking and P-Curve 4.0
  • [44] AsPredicted: Pre-registration Made Easy
  • [43] Rain & Happiness: Why Didn’t Schwarz & Clore (1983) ‘Replicate’ ?
  • [42] Accepting the Null: Where to Draw the Line?
  • [41] Falsely Reassuring: Analyses of ALL p-values
  • [40] Reducing Fraud in Science
  • [39] Power Naps: When do Within-Subject Comparisons Help vs Hurt (yes, hurt) Power?
  • [38] A Better Explanation Of The Endowment Effect
  • [37] Power Posing: Reassessing The Evidence Behind The Most Popular TED Talk
  • [36] How to Study Discrimination (or Anything) With Names; If You Must
  • [35] The Default Bayesian Test is Prejudiced Against Small Effects
  • [34] My Links Will Outlive You
  • [33] “The” Effect Size Does Not Exist
  • [32] Spotify Has Trouble With A Marketing Research Exam
  • [31] Women are taller than men: Misusing Occam’s Razor to lobotomize discussions of alternative explanations
  • [30] Trim-and-Fill is Full of It (bias)
  • [29] Help! Someone Thinks I p-hacked
  • [28] Confidence Intervals Don’t Change How We Think about Data
  • [27] Thirty-somethings are Shrinking and Other U-Shaped Challenges
  • [26] What If Games Were Shorter?
  • [25] Maybe people actually enjoy being alone with their thoughts
  • [24] P-curve vs. Excessive Significance Test
  • [23] Ceiling Effects and Replications
  • [22] You know what’s on our shopping list
  • [21] Fake-Data Colada: Excessive Linearity
  • [20] We cannot afford to study effect size in the lab
  • [19] Fake Data: Mendel vs. Stapel
  • [18] MTurk vs. The Lab: Either Way We Need Big Samples
  • [17] No-way Interactions
  • [16] People Take Baths In Hotel Rooms
  • [15] Citing Prospect Theory
  • [14] How To Win A Football Prediction Contest: Ignore Your Gut
  • [13] Posterior-Hacking
  • [12] Preregistration: Not just for the Empiro-zealots
  • [11] “Exactly”: The Most Famous Framing Effect Is Robust To Precise Wording
  • [10] Reviewers are asking for it
  • [9] Titleogy: Some facts about titles
  • [8] Adventures in the Assessment of Animal Speed and Morality
  • [7] Forthcoming in the American Economic Review: A Misdiagnosed Failure-to-Replicate
  • [6] Samples Can’t Be Too Large
  • [5] The Consistency of Random Numbers
  • [4] The Folly of Powering Replications Based on Observed Effect Size
  • [3] A New Way To Increase Charitable Donations: Does It Replicate?
  • [2] Using Personal Listening Habits to Identify Personal Music Preferences
  • [1] "Just Posting It" works, leads to new retraction in Psychology

Pages

  • About
  • Policy on Soliciting Feedback From Authors
  • Table of Contents

Get email alerts

Follow Us

  • Twitter
  • Facebook
Data Colada - All Content Licensed: CC-BY [Creative Commons]