PET-PEESE is a meta-analytical tool that seeks to correct for publication bias. In a footnote in my previous post (.htm), I referred to is as the homeopathy of meta-analysis. That was unfair and inaccurate.
Unfair because, in the style of our President, I just called PET-PEESE a name instead of describing what I believed was wrong with it. I deviated from one of my rules for 'menschplaining' (.htm): "Don't label, describe."
Inaccurate because skeptics of homeopathy merely propose that it is ineffective, not harmful. But my argument is not that PET-PEESE is merely ineffective, I believe it is also harmful. It doesn't just fail to correct for publication bias, it adds substantial bias where none exists.
note: A few hours after this blog went live, James Pustejovsky (.htm) identified a typo in the R Code which affects some results. I have already updated the code and figures below. (I archived the original post: .htm).
PET-PEESE in a NUT-SHELL
Tom Stanley (.htm), later joined by Hristos Doucouliagos, developed PET-PEESE in various papers that have each accumulated 100-400 Google cites (.pdf | .htm). The procedure consists of running a meta-regression: a regression in which studies are the unit of analysis, with effect size as the dependent variable and its variance as the key predictor [1]. The clever insight by Stanley & Doucouliagos is that the intercept of this regression is the effect we would expect in the absence of noise, thus, our estimate of the -publication bias corrected- true effect [2].
PET-PEESE in Psychology
PET-PEESE was developed with the meta-analysis of economics papers in mind (regressions with non-standardized effects). It is possible that some of the problems identified here, considering meta-analyses of standardized effect sizes, Cohen's d, do not extend to such settings [3].
Psychologists have started using PET-PEESE recently. For instance, in meta-analyses about religious primes (.pdf), working memory training (.htm), and personality of computer wizzes (.htm). Probably the most famous example is Carter et al.'s meta-analysis of ego depletion, published in JEP:G (.htm).
In this post I share simulation results that suggest we should not treat PET-PEESE estimates, at least of psychological research, very seriously. It arrives at wholly invalid estimates under too many plausible circumstances. Statistical tools need to be generally valid, or at least valid under predictable circumstances. PET-PEESE, to my understanding, is neither [4].
Results
Let's start with a baseline case for which PET-PEESE does OK: there is no publication bias, every study examines the exact same effect size, and sample sizes are distributed uniformly between n=12 and n=120 per cell. Below we see that when the true effect is d=0, PET-PEESE correctly estimates it as d̂=0, and as d gets larger, d̂ gets larger (R Code).
About 2 years ago, Will Gervais evaluated PET-PEESE in a thorough blog post (.htm) (which I have cited in papers a few times). He found that in the presence of publication bias PET-PEESE did not perform well, but that in the absence of publication bias it at least did not make things worse. The simulations depicted above are not that different from his.
Recently, however, and by happenstance, I realized that Gervais got lucky with the simulations (or I guess PET-PEESE got lucky) [5]. If we deviate slightly from some of the specifics of the ideal scenario in any of several directions, PET-PEESE no longer performs well even in the absence of publication bias.
For example, imagine that sample sizes don't go all the way to up n=120 per cell; instead, they go up to only n=50 per cell (as is commonly the case with lab studies) [6]:
A more surprisingly consequential assumption involves the symmetry of sample sizes across studies. Whether there are more small than large n studies, or vice versa, PET PEESE's performance suffers quite a bit. For example, if sample sizes look like this:
then PET-PEESE looks like this:

Micro-appendix
1) It looks worse if there are more big n than small n studies (.png).
2) Even if studies have n=50 to n=120, there is noticeable bias if n is skewed across studies (.png)
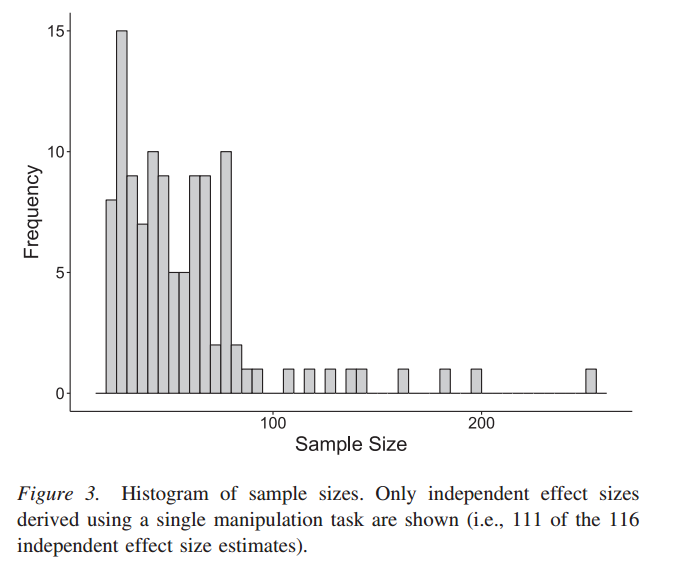
It's likely, I believe, for real meta-analyses to have skewed n distributions. e.g., this is what it looked like in that ego depletion paper (note: it plots total N, not per-cell):
So far we have assumed all studies have the exact same effect size, say all studies in the d=.4 bin are exactly d=.4. In real life different studies have different effects. For example, a meta-analysis of ego-depletion may include studies with stronger and weaker manipulations that lead to, say, d=.5 and d=.3 respectively. On average the effect may be d=.4, but it moves around. Let's see what happens if across studies the effect size has a standard deviation of SD=.2.
Micro-appendix
3) If big n studies are more common than small ns: .png
4) If n=12 to n=120 instead of just n=50, .png
Most troubling scenario
Finally, here is what happens when there is publication bias (only observe p<.05)

Micro-appendix
With publication bias,
5) If n goes up to n=120: .png
6) If n is uniform n=12 to n=50 .png
7) If d is homogeneous, sd(d)=0 .png
It does not seem prudent to rely on PET-PEESE, in any way, for analyzing psychological research. It's an invalid tool under too many scenarios.
![]()
Author feedback.
Our policy is to share early drafts of our post with authors whose work we discuss. I shared this post with the creators of PET-PEESE, and also with others familiar with it: Will Gervais, Daniel Lakens, Joe Hilgard, Evan Carter, Mike McCullough and Bob Reed. Their feedback helped me identify an important error in my R Code, avoid some statements that seemed unfair, and become aware of the recent SPPS paper by Tom Stanley (see footnote 4). During this process I also learned, to my dismay, that people seem to believe -incorrectly- that p-curve is invalidated under heterogeneity of effect size. A future post will discuss this issue, impatient readers can check out our p-curve papers, especially Figure 1 in our first paper (here) and Figure S2 in our second (here), which already address it; but evidently insufficiently compellingly.
Last but not least, everyone I contacted was offered an opportunity to reply within this post. Both Tom Stanley (.pdf), and Joe Hilgard (.pdf) did.
- Actually, that's just PEESE; PET uses the standard error as the predictor [↩]
- With PET-PEESE one runs both regressions. If PET is significant, one uses PEESE; if PET is not significant, one uses PET (!). [↩]
- Though a working paper by Alinaghi and Reed suggests PET-PEESE performs poorly there as well .pdf [↩]
- I shared an early draft of this paper with various peers, including Daniel Lakens and Stanley himself. They both pointed me to a recent paper in SPPS by Stanley (.htm). It identifies conditions under which PET-PEESE gives bad results. The problems I identify here are different, and much more general than those identified there. Moreover, results presented here seem to directly contradict the conclusions from the SPPS paper. For instance, Stanley proposes that if the observed heterogeneity in studies is I2<80% we should trust PET-PEESE, and yet, in none of the simulations I present here, with utterly invalid results, is I2>80%; thus I would suggest to readers to not follow that advice. Stanley (.htm) also points out that when there are 20 or fewer studies PET-PEESE should not be used; all my simulations assume 100 studies, and the results do not improve with a smaller sample of studies. [↩]
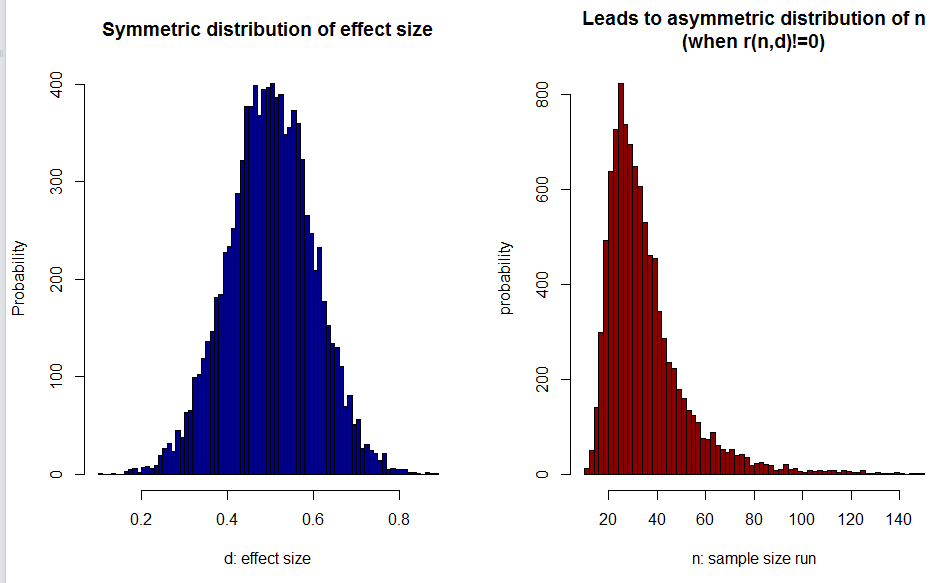
- In particular, when preparing Colada[58] I simulated meta-analyses where, instead of choosing sample size at random, as the funnel-plot assumes, researchers choose larger samples to study smaller effects. I found truly spectacularly poor performance by PET-PEESE, much worse that trim-and-fill. Thinking about it, I realized that if researchers do any sort of power calculations, even intuitive or based on experience, then a symmetric distributions of effect size leads to an asymmetric distributions of sample size. See this illustrative figure (R Code):

So it seemed worth checking if asymmetry alone, even if researchers were to set sample size at random, led to worse performance for PET-PEESE. And it did. [↩] - e.g., using d.f. in t-test from scraped studies as data, back in 2010, the median n in Psych Science was about 18, and around 85% of studies were n<50 [↩]


