A recent failure to replicate led to an attention-grabbing debate in psychology.
As you may expect from university professors, some of it involved data. As you may not expect from university professors, much of it involved saying mean things that would get a child sent to the principal's office (.pdf).
The hostility in the debate has obscured an interesting empirical question. This post aims to answer that interesting empirical question. [1]
Ceiling effect
The replication (.html) was pre-registered; it was evaluated and approved by peers, including the original authors, before being run. The predicted effect was not obtained, in two separate replication studies.
The sole issue of contention regarding the data (.xlsx), is that nearly twice as many respondents gave the highest possible answer in the replication as in the original study (about 41% vs about 23%). In a forthcoming commentary (.html), the original author proposes a "ceiling effect" explanation: it is hard to increase something that is already very high.
I re-analyzed the original and replication data to assess this sensible concern.
My read is that the evidence is greatly inconsistent with the ceiling effect explanation.
The experiments
In the original paper (.html), participants rated six "dilemmas" involving moral judgments (e.g., How wrong is it to keep money found in a lost wallet?). These judgments were predicted to become less harsh for people primed with cleanliness (Study 1) or who just washed their hands (Study 2).
The new analysis
In a paper with Joe and Leif (SSRN), we showed that a prominent failure to replicate in economics was invalidated by a ceiling effect. I use the same key analysis here. [2]
It consists of going beyond comparing means, examining instead all observations.The stylized figures below give the intuition. They plot the cumulative percentage of observations for each value of the dependent variable.
The first shows an effect across the board: there is a gap between the curves throughout.
The third shows the absence of an effect: the curves perfectly overlap.
 The middle figure captures what a ceiling effect looks like. All values above 2 were brought down to 2 so the lines overlap there, but below the ceiling the gap is still easy to notice.
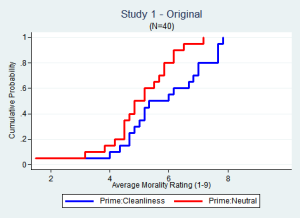
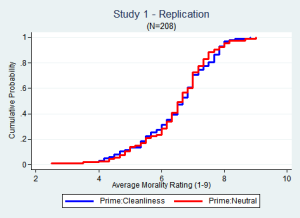
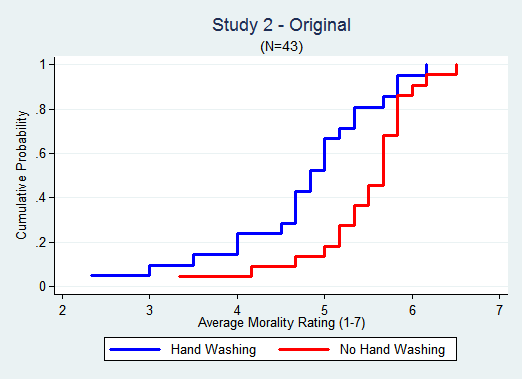
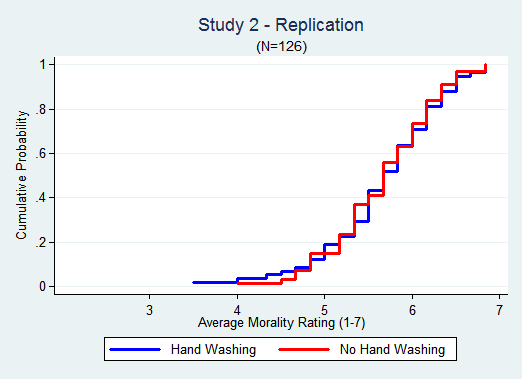
Let's now look at real data. Study 1 first: [3]


It is easy to spot the effect in the original data.
It is just as easy to spot the absence of an effect in the replication.
In the Original the effect is largest in the 4-6 range. In the Replication about 60% of the data is in that range, far from the ceiling of 7. But still there is no gap between the lines.
Ceiling analysis by original author
In her forthcoming commentary (.pdf), effect size is computed as a percentage and shown to be smaller in scenarios with higher baseline levels (see her Figure 1). This is interpreted as evidence of a ceiling effect.
I don't think that's right.
Dividing something by increasingly larger numbers leads to increasingly smaller ratios, with or without a ceiling. Imagine the effect were constant, completely unaffected by ceiling effects. Say a 1 point increase in the morality scale in every scenario. This constant effect would be a smaller % in scenarios with a larger baseline; going from 2 to 3 is a 50% increase, whereas going from 9 to 10 only 11%. [4]
If a store-owner gives you $5 off any item, buying a $25 calculator gets you a 20% discount, buying a $100 jacket gets you only a 5% discount. But there is no ceiling, you are getting $5 in both cases.
To eliminate the arithmetic confound, I redid this analysis with effect size defined as the difference of means, rather than %, and there was no association between effect size and share of answers at boundary across scenarios (see calculations, .xlsx).
Ceiling analysis by replicators
In their rejoinder (.pdf), the replicators counter by dropping all observations at the ceiling and showing the results are still not significant.
I don't think that's right either.
Dropping observations at the boundary lowers power whether there is a ceiling effect or not, by a lot. In simulations, I saw drops of 30% and more, say from 50% to 20% power (R Code). So not getting an effect this way does not support the absence of a ceiling effect problem.
Tobit
To formally take ceiling effects into account one can use the Tobit model (common in economics for censored data, see Wikipedia). A feature of this approach is that it allows analyzing the data at the scenario level, where the ceiling effect would actually be happening. I run Tobits on all datasets. The replications still had tiny effect sizes (<1/20th size of original), with p-values>.8 (STATA code). [5]
![]()
Authors' response
Our policy at DataColada is to give drafts of our post to authors whose work we cover before posting, asking for feedback and providing an opportunity to comment. This causes delays (see footnote 1) but avoids misunderstandings.
The replication authors, Brent Donnellan, Felix Cheung and David Johnson suggested minor modifications to analyses and writing. They are reflected in the version you just read.
The original author, Simone Schnall, suggested a few edits also, and asked me to include this comment from her:
Your analysis still does not acknowledge the key fact: There are significantly more extreme scores in the replication data (38.5% in Study 1, and 44.0% in Study 2) than in the original data. The Tobin analysis is a model-based calculation and makes certain assumptions; it is not based on the empirical data. In the presence of so many extreme scores a null result remains inconclusive.
- This blogpost was drafted on Thursday May 29th and was sent to original and replication authors for feedback, offering also an opportunity to comment. The dialogue with Simone Schnall lasted until June 3rd, which is why it appears only today. In the interim Tal Yarkoni and Yoel Inbar, among others, posted their own independent analyses. [↩]
- Actually, in that paper it was a floor effect [↩]
- The x-axis on these graphs had a typo that we were alerted to by Alex Perrone in August, 2014. The current version is correct [↩]
- She actually divides by the share of observations at ceiling, but the same intuition and arithmetic apply. [↩]
- I treat the experiment as nested, with 6 repeated-measures for each participant, one per scenario [↩]


