Recently, a psychology paper (.html) was flagged as possibly fraudulent based on statistical analyses (.pdf). The author defended his paper (.html), but the university committee investigating misconduct concluded it had occurred (.pdf).
In this post we present new and more intuitive versions of the analyses that flagged the paper as possibly fraudulent. We then rule out p-hacking among other benign explanations.
Excessive linearity
The whistleblowing report pointed out the suspicious paper had excessively linear results.
That sounds more technical than it is.
Imagine comparing the heights of kids in first, second, and third grade, with the hypothesis that higher grades have taller children. You get samples of n=20 kids in each grade, finding average heights of: 120 cms, 126 cms, and 130 cms. That’s almost a perfectly linear pattern, 2nd graders [126], are almost exactly between the other two groups [mean(120,130)=125].
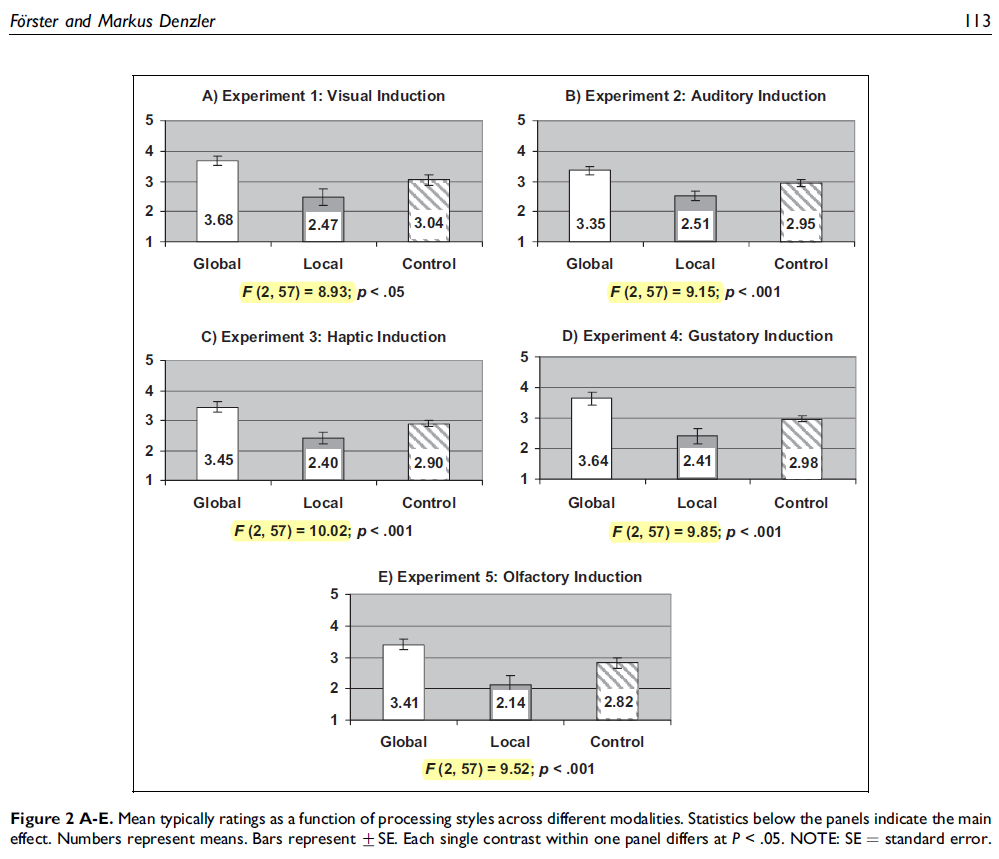
The scrutinized paper has 12 studies with three conditions each. The Control was too close to the midpoint of the other two in all of them. It is not suspicious for the true effect to be linear. Nothing wrong with 2nd graders being 125 cm tall. But, real data are noisy, so even if the effect is truly and perfectly linear, small samples of 2nd graders won’t average 125 every time.
Our new analysis of excessive linearity
The original report estimated a less than 1 in 179 million chance that a single paper with 12 studies would lead to such perfectly linear results. Their approach was elegant (subjecting results from two F-tests to a third F-test) but a bit technical for the uninitiated.
We did two things differently:
(1) Created a more intuitive measure of linearity, and
(2) Ran simulations instead of relying on F-distributions.
Intuitive measure of linearity
For each study, we calculated how far the Control condition was from the midpoint of the other two. So if in one study the means were: Low=0, Control=61, High=100, our measure compares the midpoint, 50, to the 61 from the Control, and notes they differ by 11% of the High-Low distance. [1]
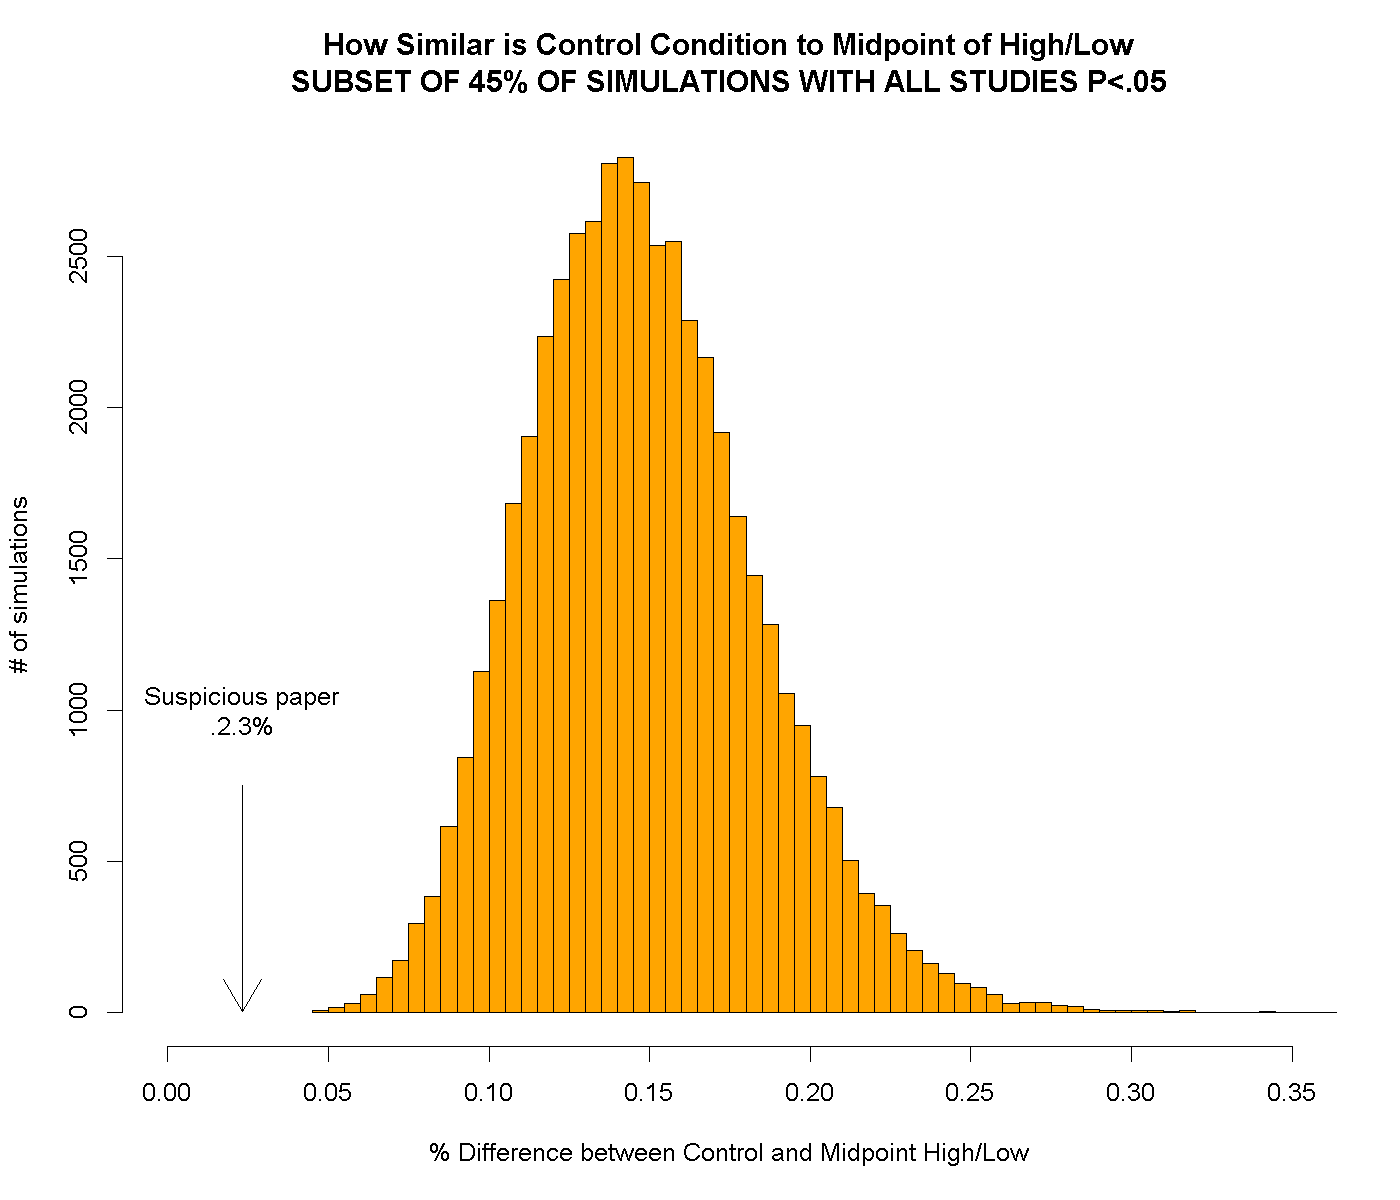
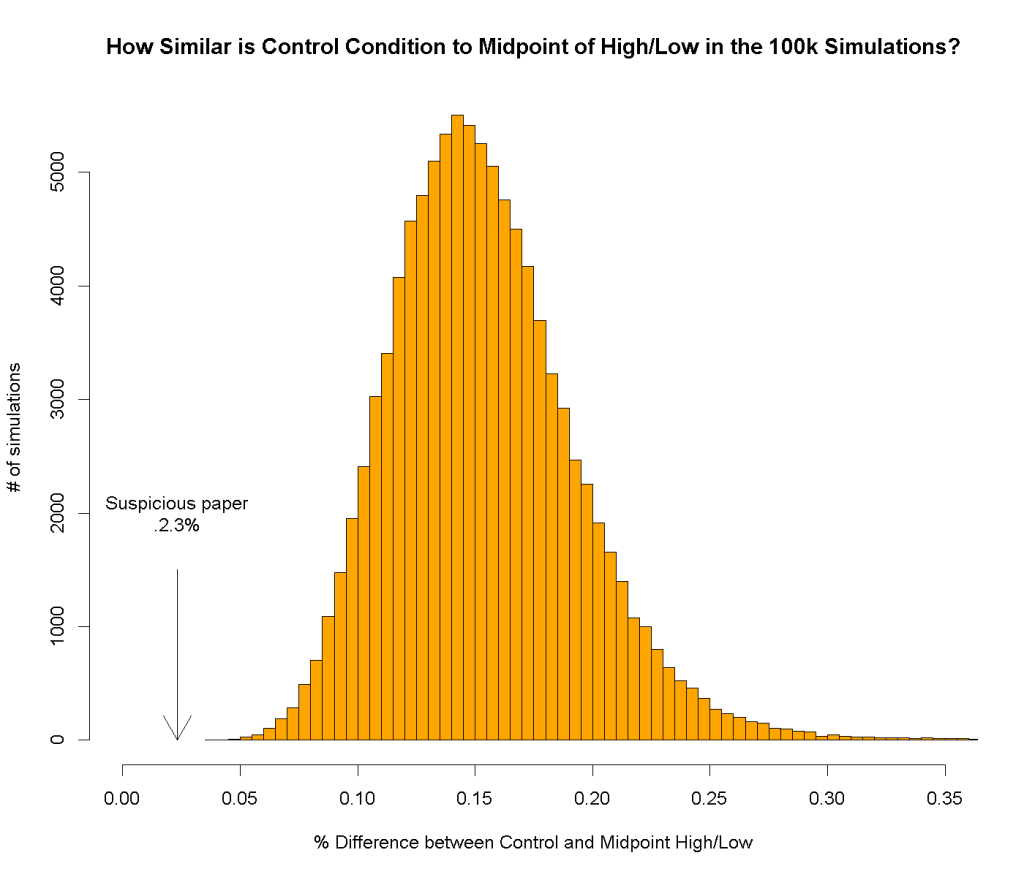
Across the 12 studies, the Control conditions were on average just 2.3% away from the midpoint. We ran simulations to see how extreme that 2.3% was.
Simulations
We drew samples from populations with means and standard deviations equal to those reported in the suspicious paper. Our simulated variables were discrete and bounded, as in the paper, and we assumed that the true mean of the Control was exactly midway between the other two. [2] We gave the reported data every benefit of the doubt.
(see R Code)
Results
Recall that in the suspicious paper the Control was off by just 2.3% from the midpoint of the other two conditions. How often did we observe such a perfectly linear result in our 100,000 simulations?
Never.
In real life, studies need to be p<.05 to be published. Could that explain it?
We redid the above chart including only the 45% of simulated papers in which all 12 studies were p<.05. The results changed so little that to save space we put the (almost identical) chart here
A second witness. Excessive similarity across studies
The original report also noted very similar effect sizes across studies.


The F-values are not just surprisingly large, they are also surprisingly stable across studies.
Just how unlikely is that?
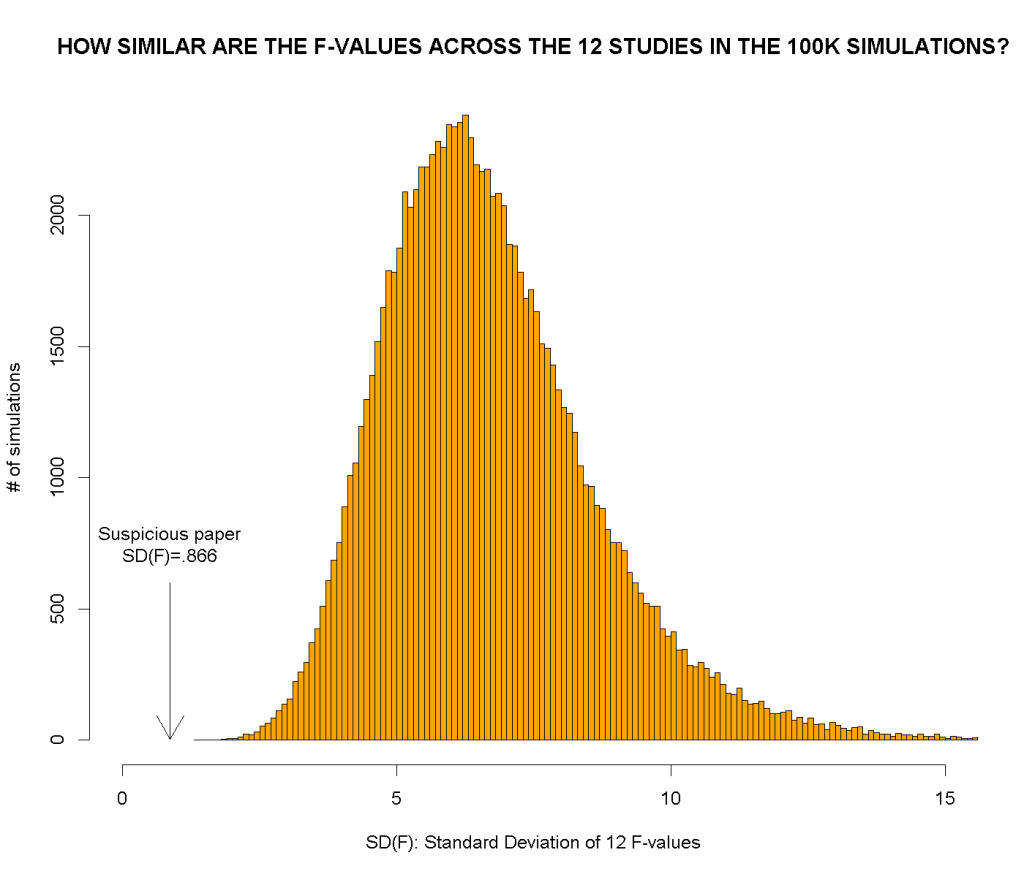
We computed the simplest measure of similarity we could think of: the standard deviation of F() across the 12 studies. In the suspicious paper, see figure above, SD(F)=SD(8.93, 9.15, 10.02…)=.866. We then computed SD(F) for each of the simulated papers.
How often did we observe such extreme similarity in our 100,000 simulations?
Never.
Two red flags
For each simulated paper we have two measures of excessive similarity “Control is too close to High-Low midpoint,” and “SD of F-values”. These proved uncorrelated in our simulations (r = .004), so they provide independent evidence of aberrant results, we have a conceptual replication of "these data are not real." [3]
Alternative explanations
1. Repeat subjects?
Some have speculated that perhaps some participants took part in more than one of the studies. Because of random assignment to condition that wouldn’t help explain consistency in differences across conditions in different studies. Possibly it would make things worse; repeat participants would increase variability, as studies would differ in the mixture of experienced and inexperienced participants.
2. Recycled controls?
Others have speculated that perhaps the same control condition was used in multiple studies. But controls were different across studies. e.g., Study 2 involved listening to poems, Study 1 seeing letters.
3. Innocent copy-paste error?
Recent scandals in economics (.html) and medicine (.html) have involved copy-pasting errors before running analyses. Here so many separate experiments are involved, with the same odd patterns, that unintentional error seems implausible.
4. P-hacking?
To p-hack you need to drop participants, measures, or conditions. The studies have the same dependent variables, parallel manipulations, same sample sizes and analysis. There is no room for selective reporting.
In addition, p-hacking leads to p-values just south of .05 (see our p-curve paper, SSRN). All p-values in the paper are smaller than p=.0008. P-hacked findings do not reliably get this pedigree of p-values.
Actually, with n=20, not even real effects do.
- The measure=|((High+Low)/2 – Control)/(High-Low)| [↩]
- Thus, we don’t use the reported Control mean; our analysis is much more conservative than that [↩]
- Note that the SD(F) simulation is not under the null that the F-values are the same, but rather, under the null that the Control is the midpoint. We also carried out 100,000 simulations under this other null and also never got SD(F) that small [↩]


