Kahneman and Tversky’s (1979) “Prospect Theory” article is the most cited paper in the history of economics, and it won Kahneman the Nobel Prize in 2002. Among other things, it predicts that people are risk seeking for unlikely gains (e.g., they pay more than $1 for a 1% chance of $100) but risk averse for unlikely losses (e.g., they pay more than $1 to avoid 1% chance of losing $100).
These patterns have been replicated in dozens, possibly hundreds of studies.
A just-published American Economic Review (AER) paper, claims that Prospect Theory gives an incorrect explanation for these patterns. The author proposes that the patterns are not driven by how people think about probabilities or outcomes, but instead by “complexity”, the mental “difficulty of valuing a disaggregated object” (p.3791). Indeed, the abstract says that “much of the behavior motivating our most important behavioral theories of risk derive from complexity-driven mistakes“. Exactly how “complexity” impacts valuations in general, or how it leads to the same predictions as prospect theory, is not discussed in the paper. [1]
The AER paper reports on five similar experiments in which participants said how much they value different lotteries (e.g., 10% chance of $25) as well as how much they valued something called riskless “mirrors”. Mirrors are prospects assumed to have similar complexity, but without any risk (e.g., getting 10% of $25 for sure, so $2.50 for sure, but expressed in a ‘complex’ way).
The paper’s first main finding is that valuations for lotteries and mirrors are “virtually identical” (p. 3797). That is, despite mirrors having no risk, people value them as if they were lotteries. This is consistent with the “complexity” hypothesis.
With Daniel Banki, Robert Walatka, and George Wu, we recently posted to SSRN a commentary on this paper (htm). In this post I share some of our analyses. Any views expressed here, and the writing style, are my own, not necessarily theirs. But all the analyses are joint work.
OK, let’s not bury the lede. The experiment confused many participants. 75% of them erred in the comprehension questions; for the remaining 25%, median valuations of lotteries and mirrors were very different. Mirrors were priced at expected value, lotteries in line with prospect theory.
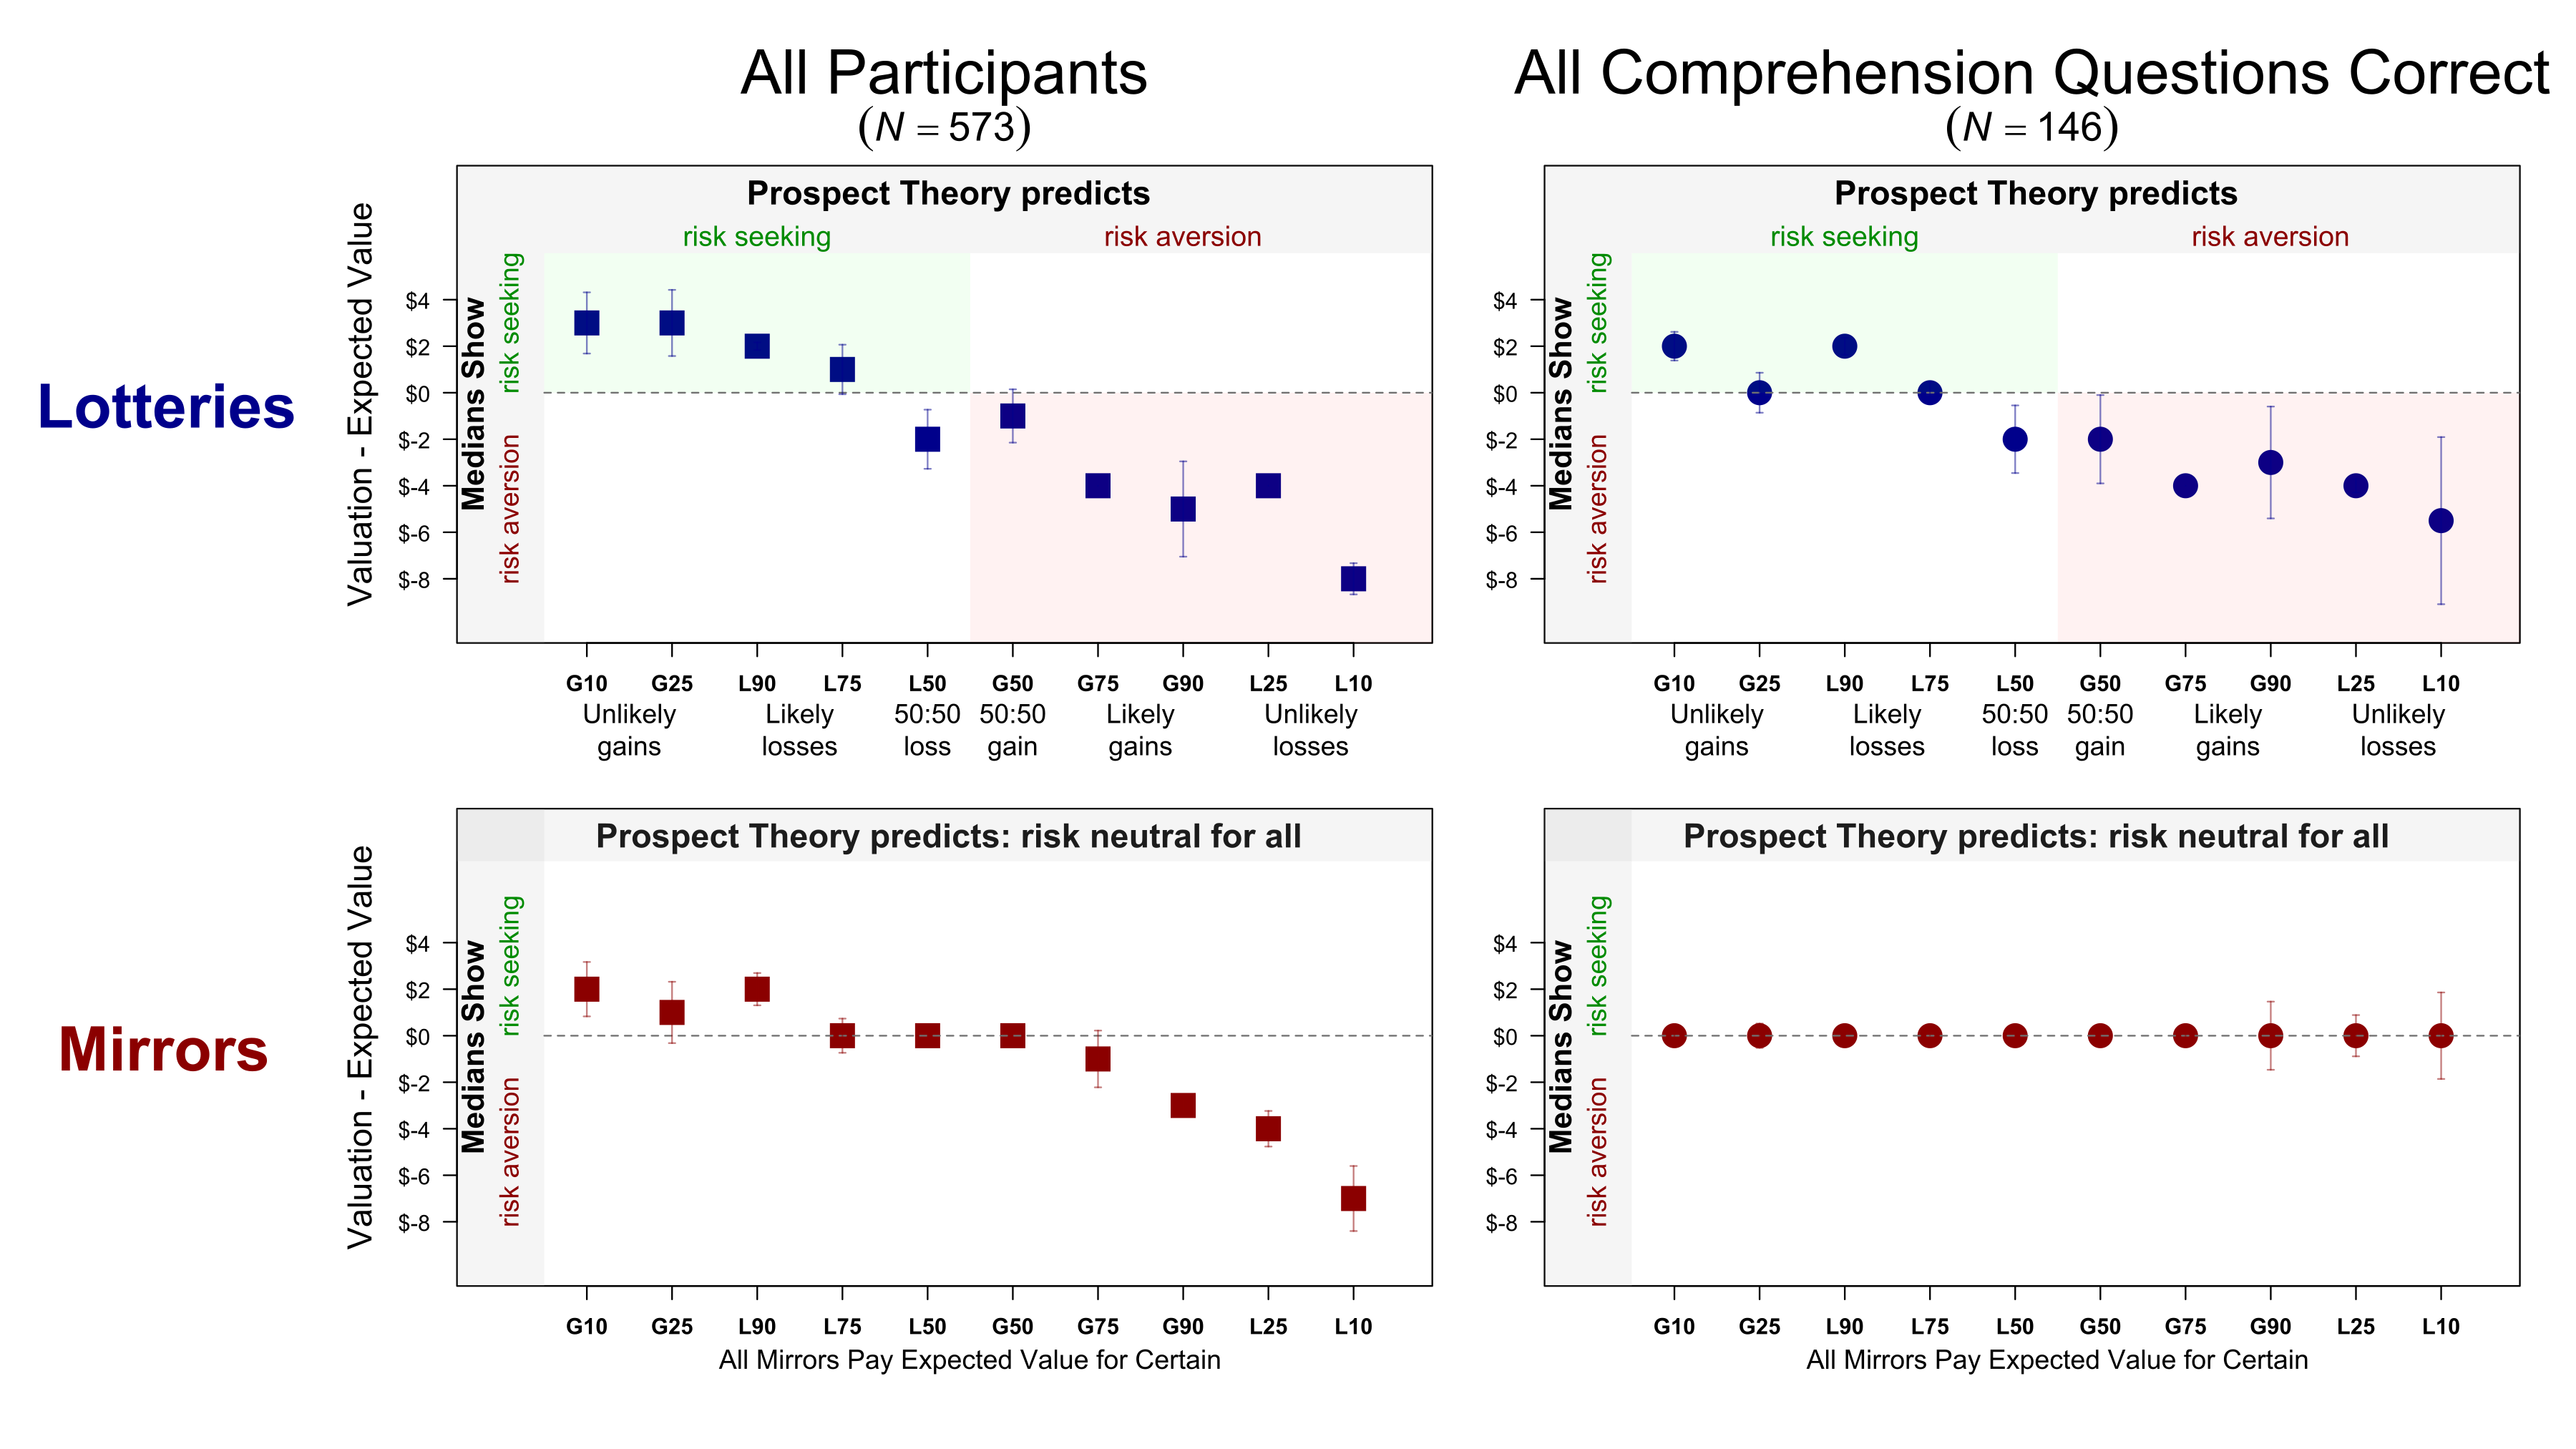 Figure 1. Differences between expected value and median valuations.
[2025-03-23/31: dropped incorrect statement from caption/edited right header]
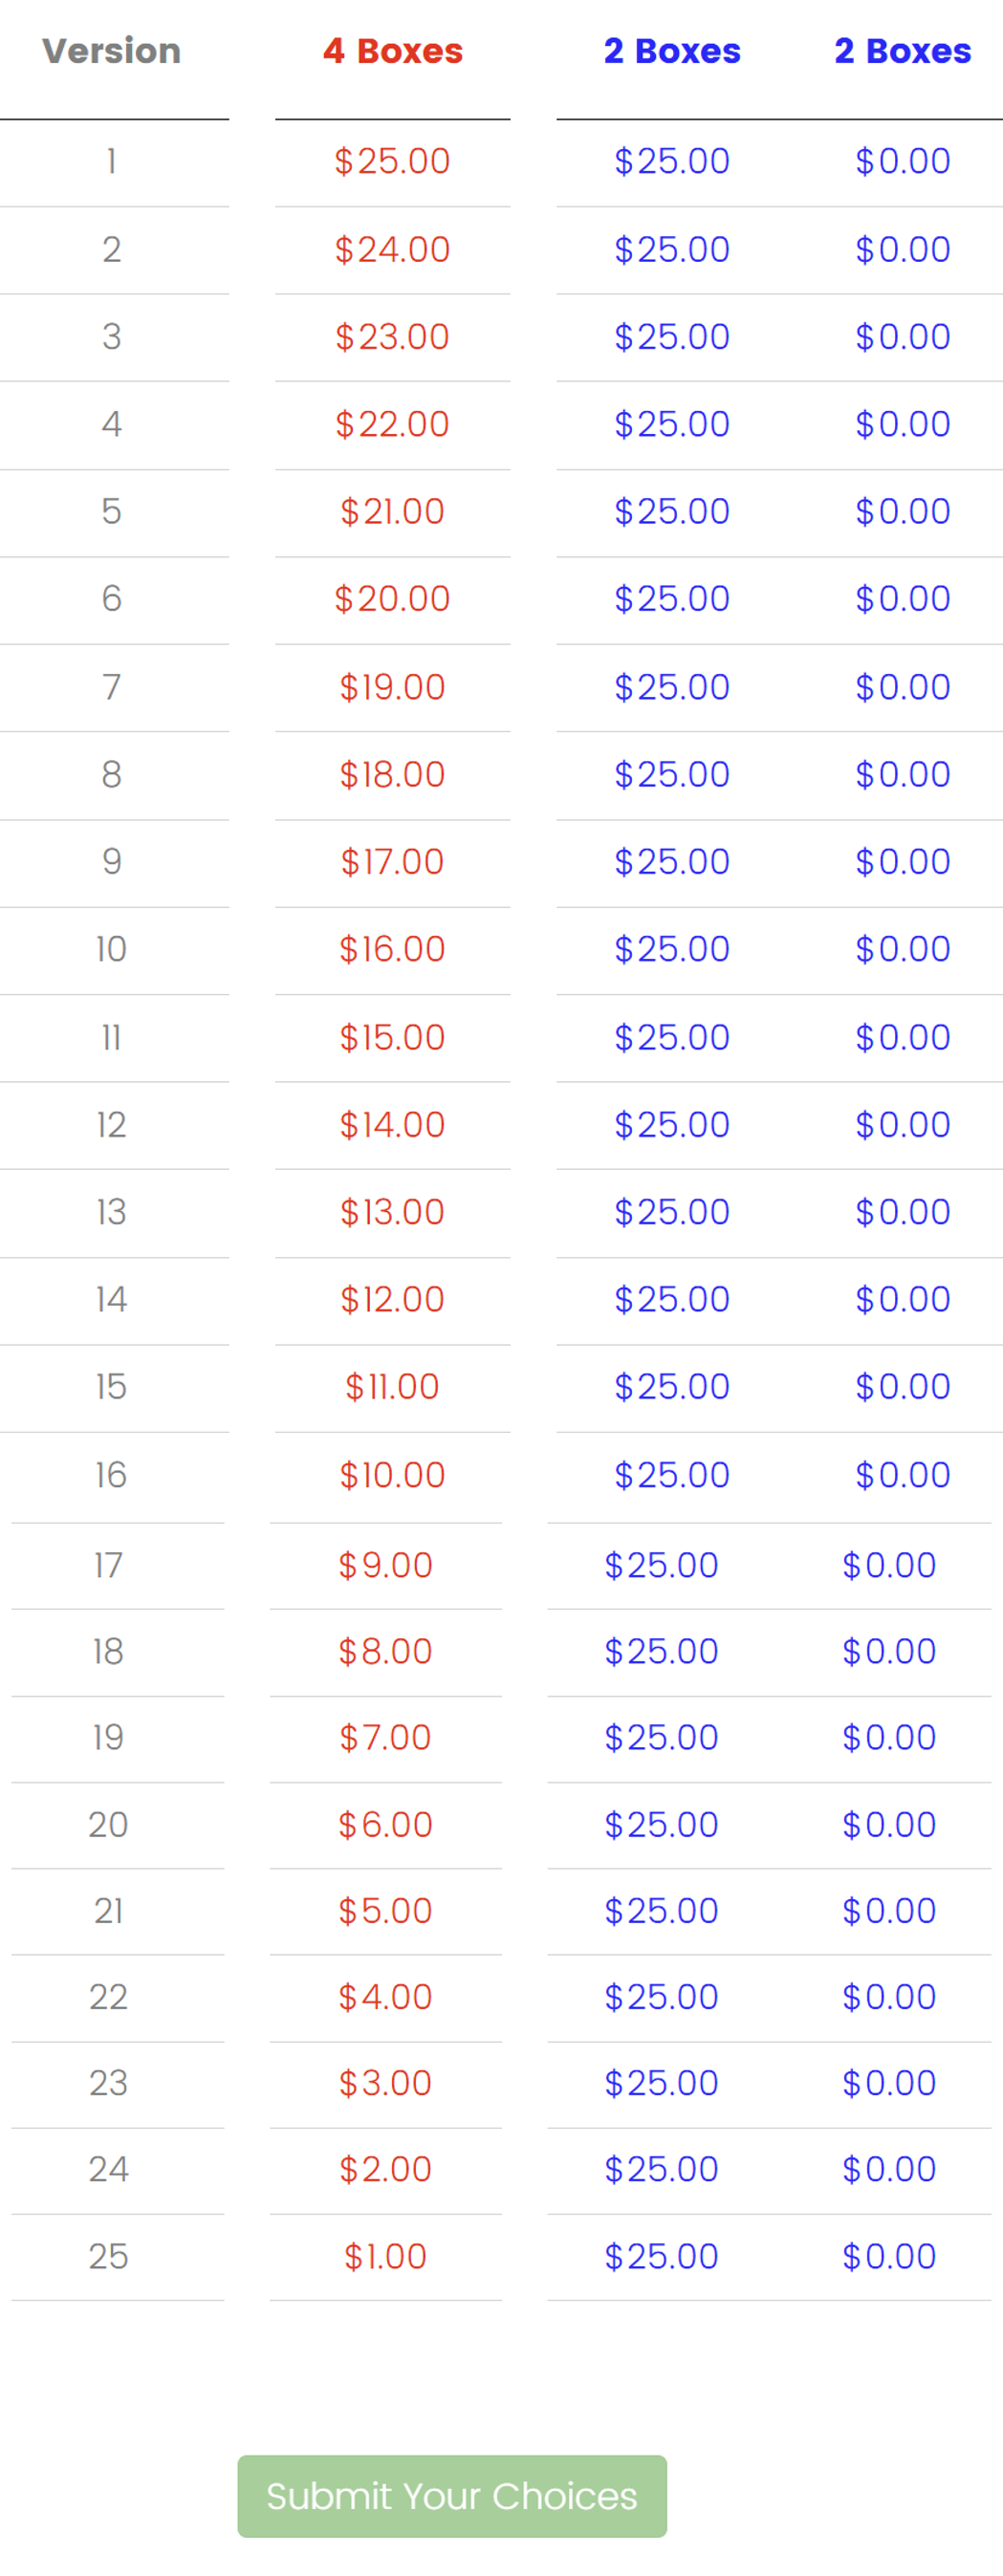
Boxes
The experiments implemented both mirrors and lotteries by asking participants to consider sets of imaginary boxes. For example, the 10% of $25 lottery and mirror showed participants 100 boxes where 10 contained $25 and 90 contained $0. For lotteries, the participants were told to imagine opening a random box and getting whatever was in it. For mirrors, participants were paid “the sum of the rewards in all of the boxes, weighted by the total number of boxes” (p. 3790).
Value elicitation
In addition to understanding the lotteries and mirrors, participants had to understand how to communicate their valuations. In psychology we usually ask hypotheticals straight up: “how much do you value this thing?”, but in econ they like including incentives, which can complicate things. The screenshot below shows instructions for a mirror involving losses. [2],[3]
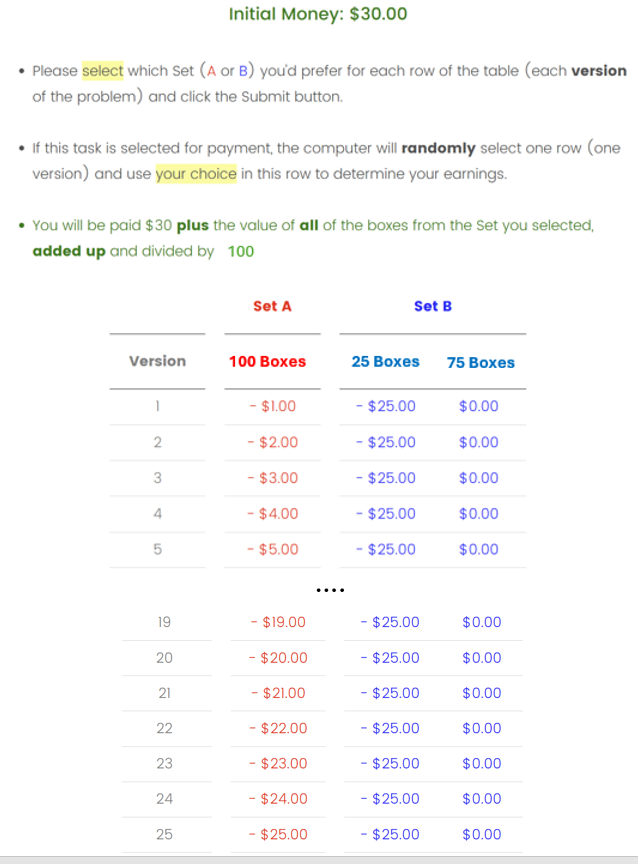
I have a hard time imagining the person who struggles to understand “10% chance of $25”, yet has no difficulty interpreting these instructions.
Imagine you wanted to assess the impact of carrying a brick on how well people can run, and in your study people needed to carry the brick on top of a heavy backpack. 
You need an empty backpack to study the impact of carrying a brick.
Similarly, I think you need a simple experiment to study the impact of lottery complexity.
Did people understand how to provide their valuations? We don’t know because there were no comprehension questions about it. But there were comprehension questions about the mirrors and lotteries. Did people understand them? Many didn’t.
Comprende?
Participants were asked 4 multiple-choice comprehension questions about a 50:50 lottery that paid $16 or $0 (and another 4 questions about the corresponding mirror). Participants were asked the probability of getting different payoffs (e.g., of getting $16). Each question had only 3 possible answers. If participants provided the wrong answer, they could try again until they provided the correct one. People made tons of errors.
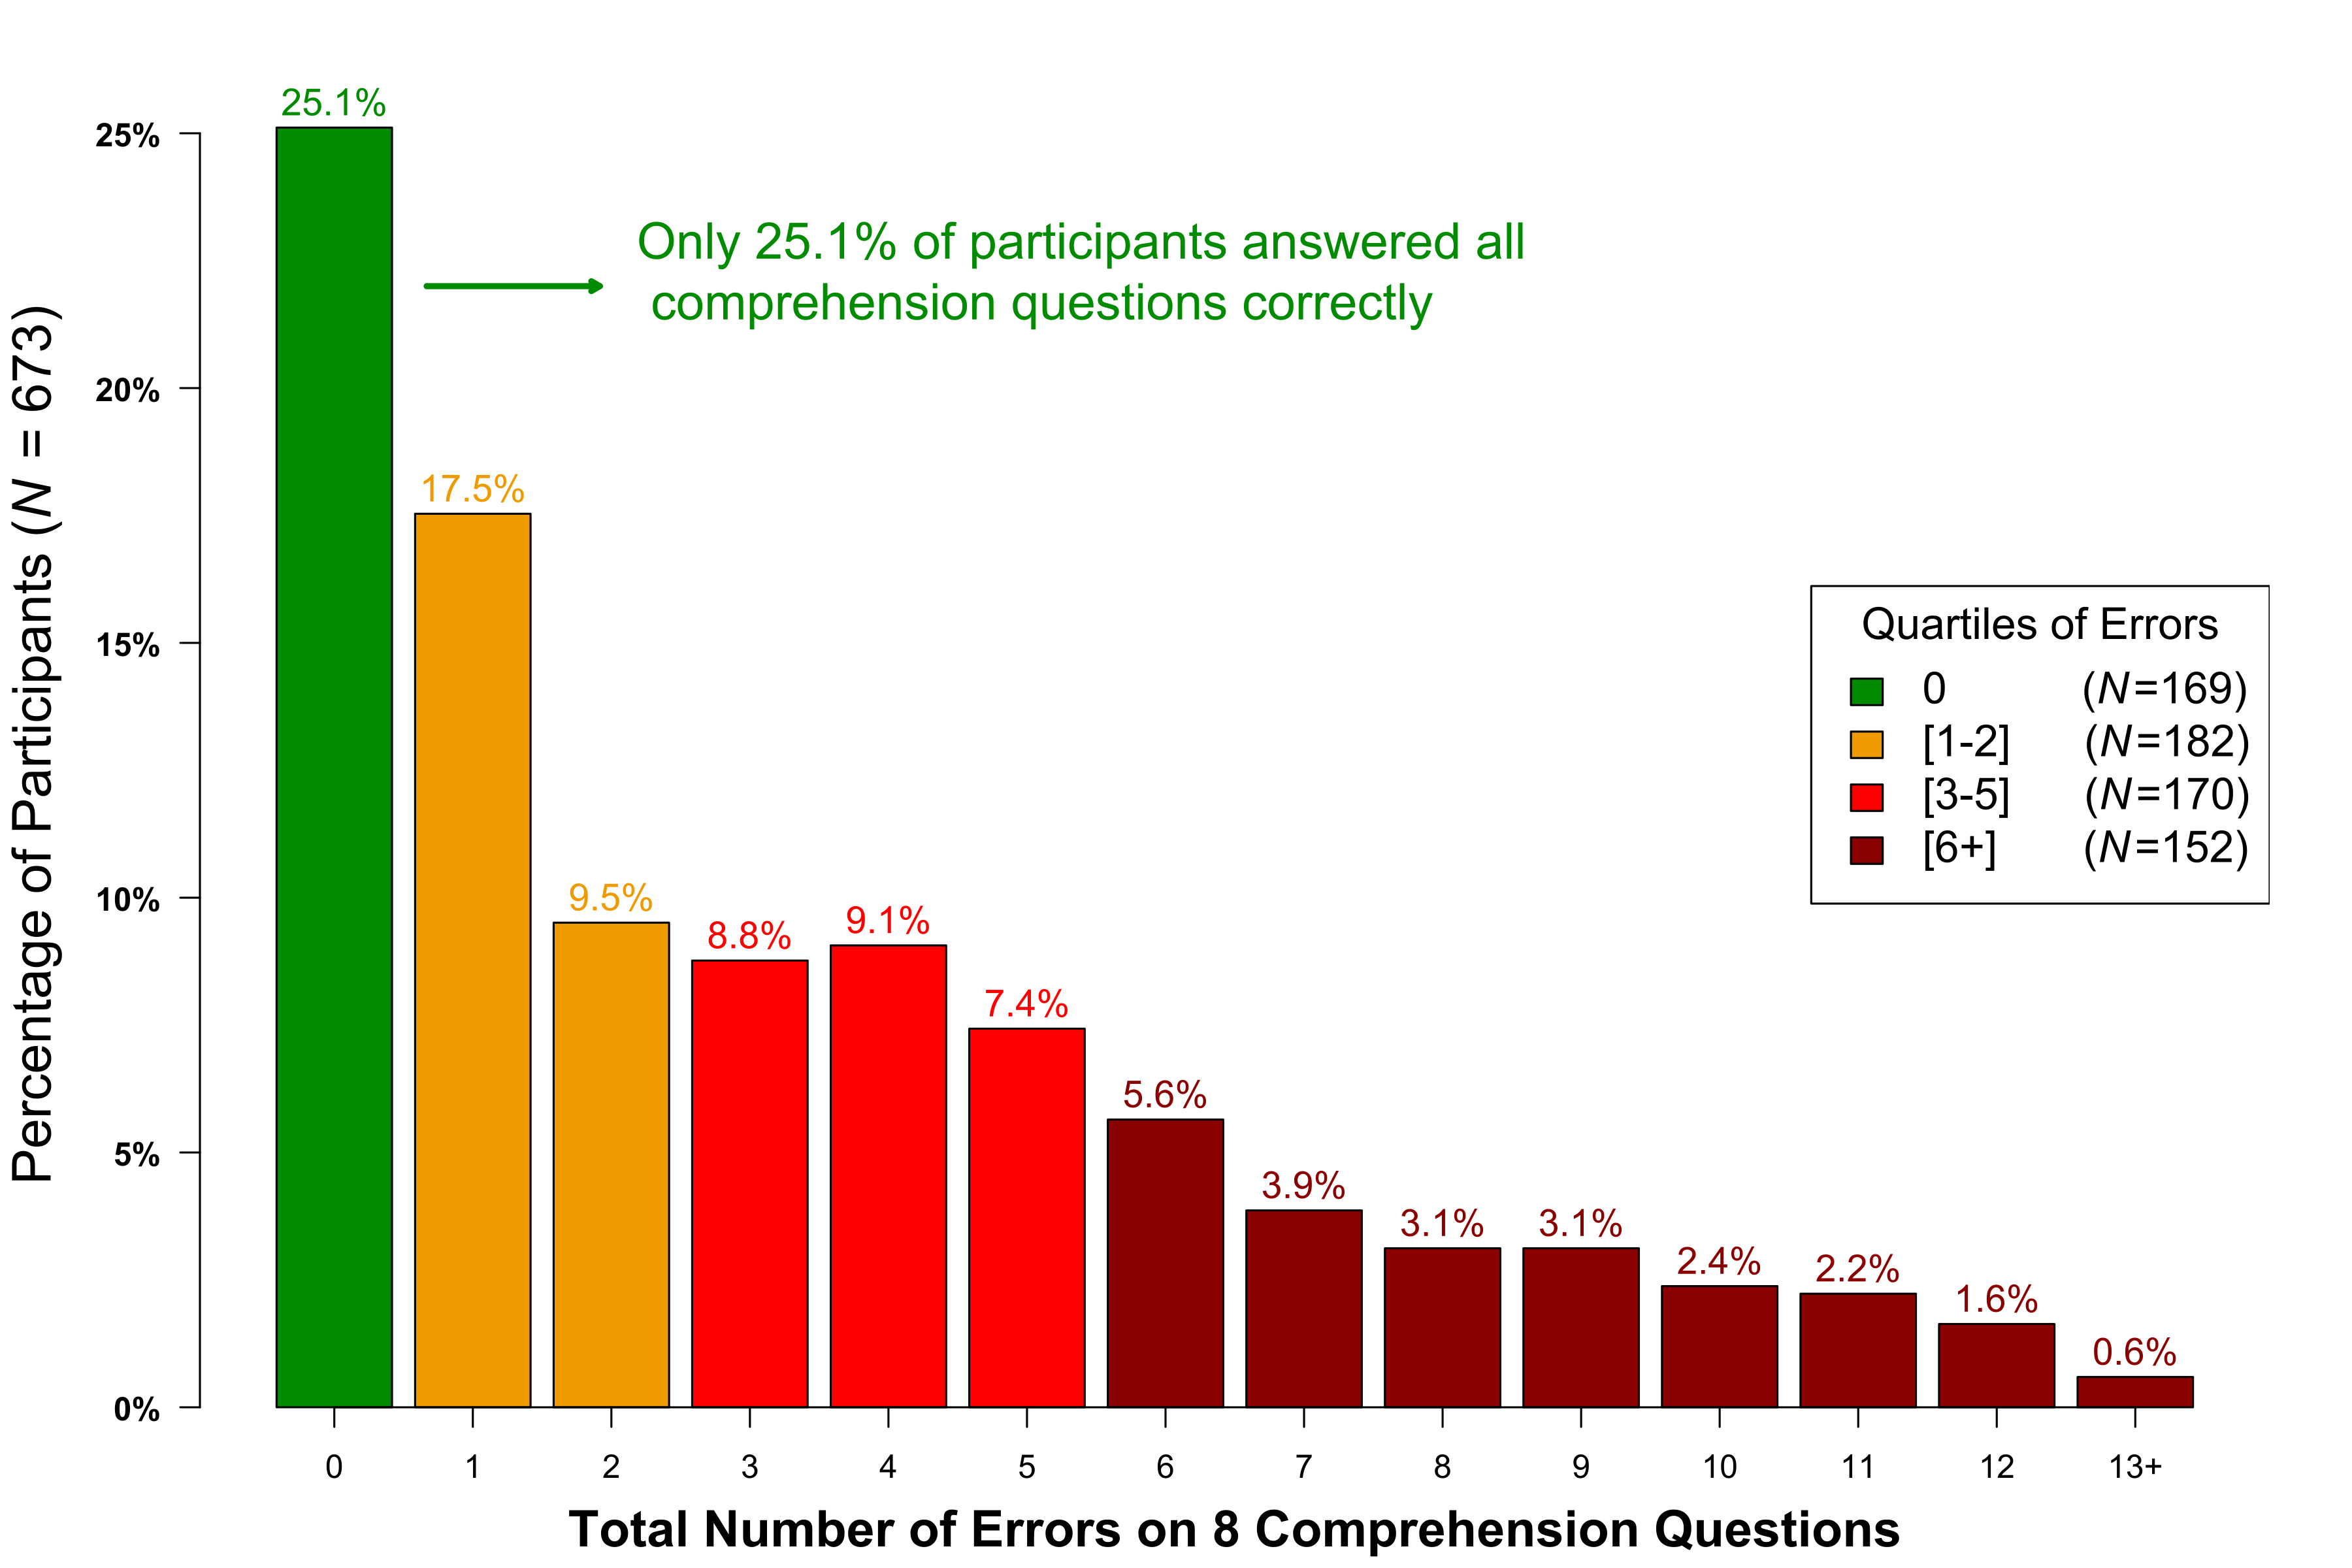
Fig 2. Distribution of number of errors per participant
That’s not very promising, but it’s possible that participants got these questions wrong, learned from seeing the correct answer, and by the time they started valuing boxes for real they had figured out how everything worked. Let’s see.
There is something economists call “first-order stochastic dominance.” It means that people should pay more for strictly better things. So people should pay more for a 90% chance of $25 than for a 10% chance of $25. For short I will call this “being coherent”. If people misunderstood the boxes, we may expect some of them to be incoherent. And they were.
In Figure 3 we compare the share of participants that were incoherent in previously published papers, vs in studies in the AER paper. In earlier experiments, about 3% of participants were incoherent, in the AER paper 21% were. While people with the most errors were the most incoherent, even the best participants in the AER paper, those with zero comprehension errors, were worse (12.4%) than participants overall in every previous study (<11.4%).
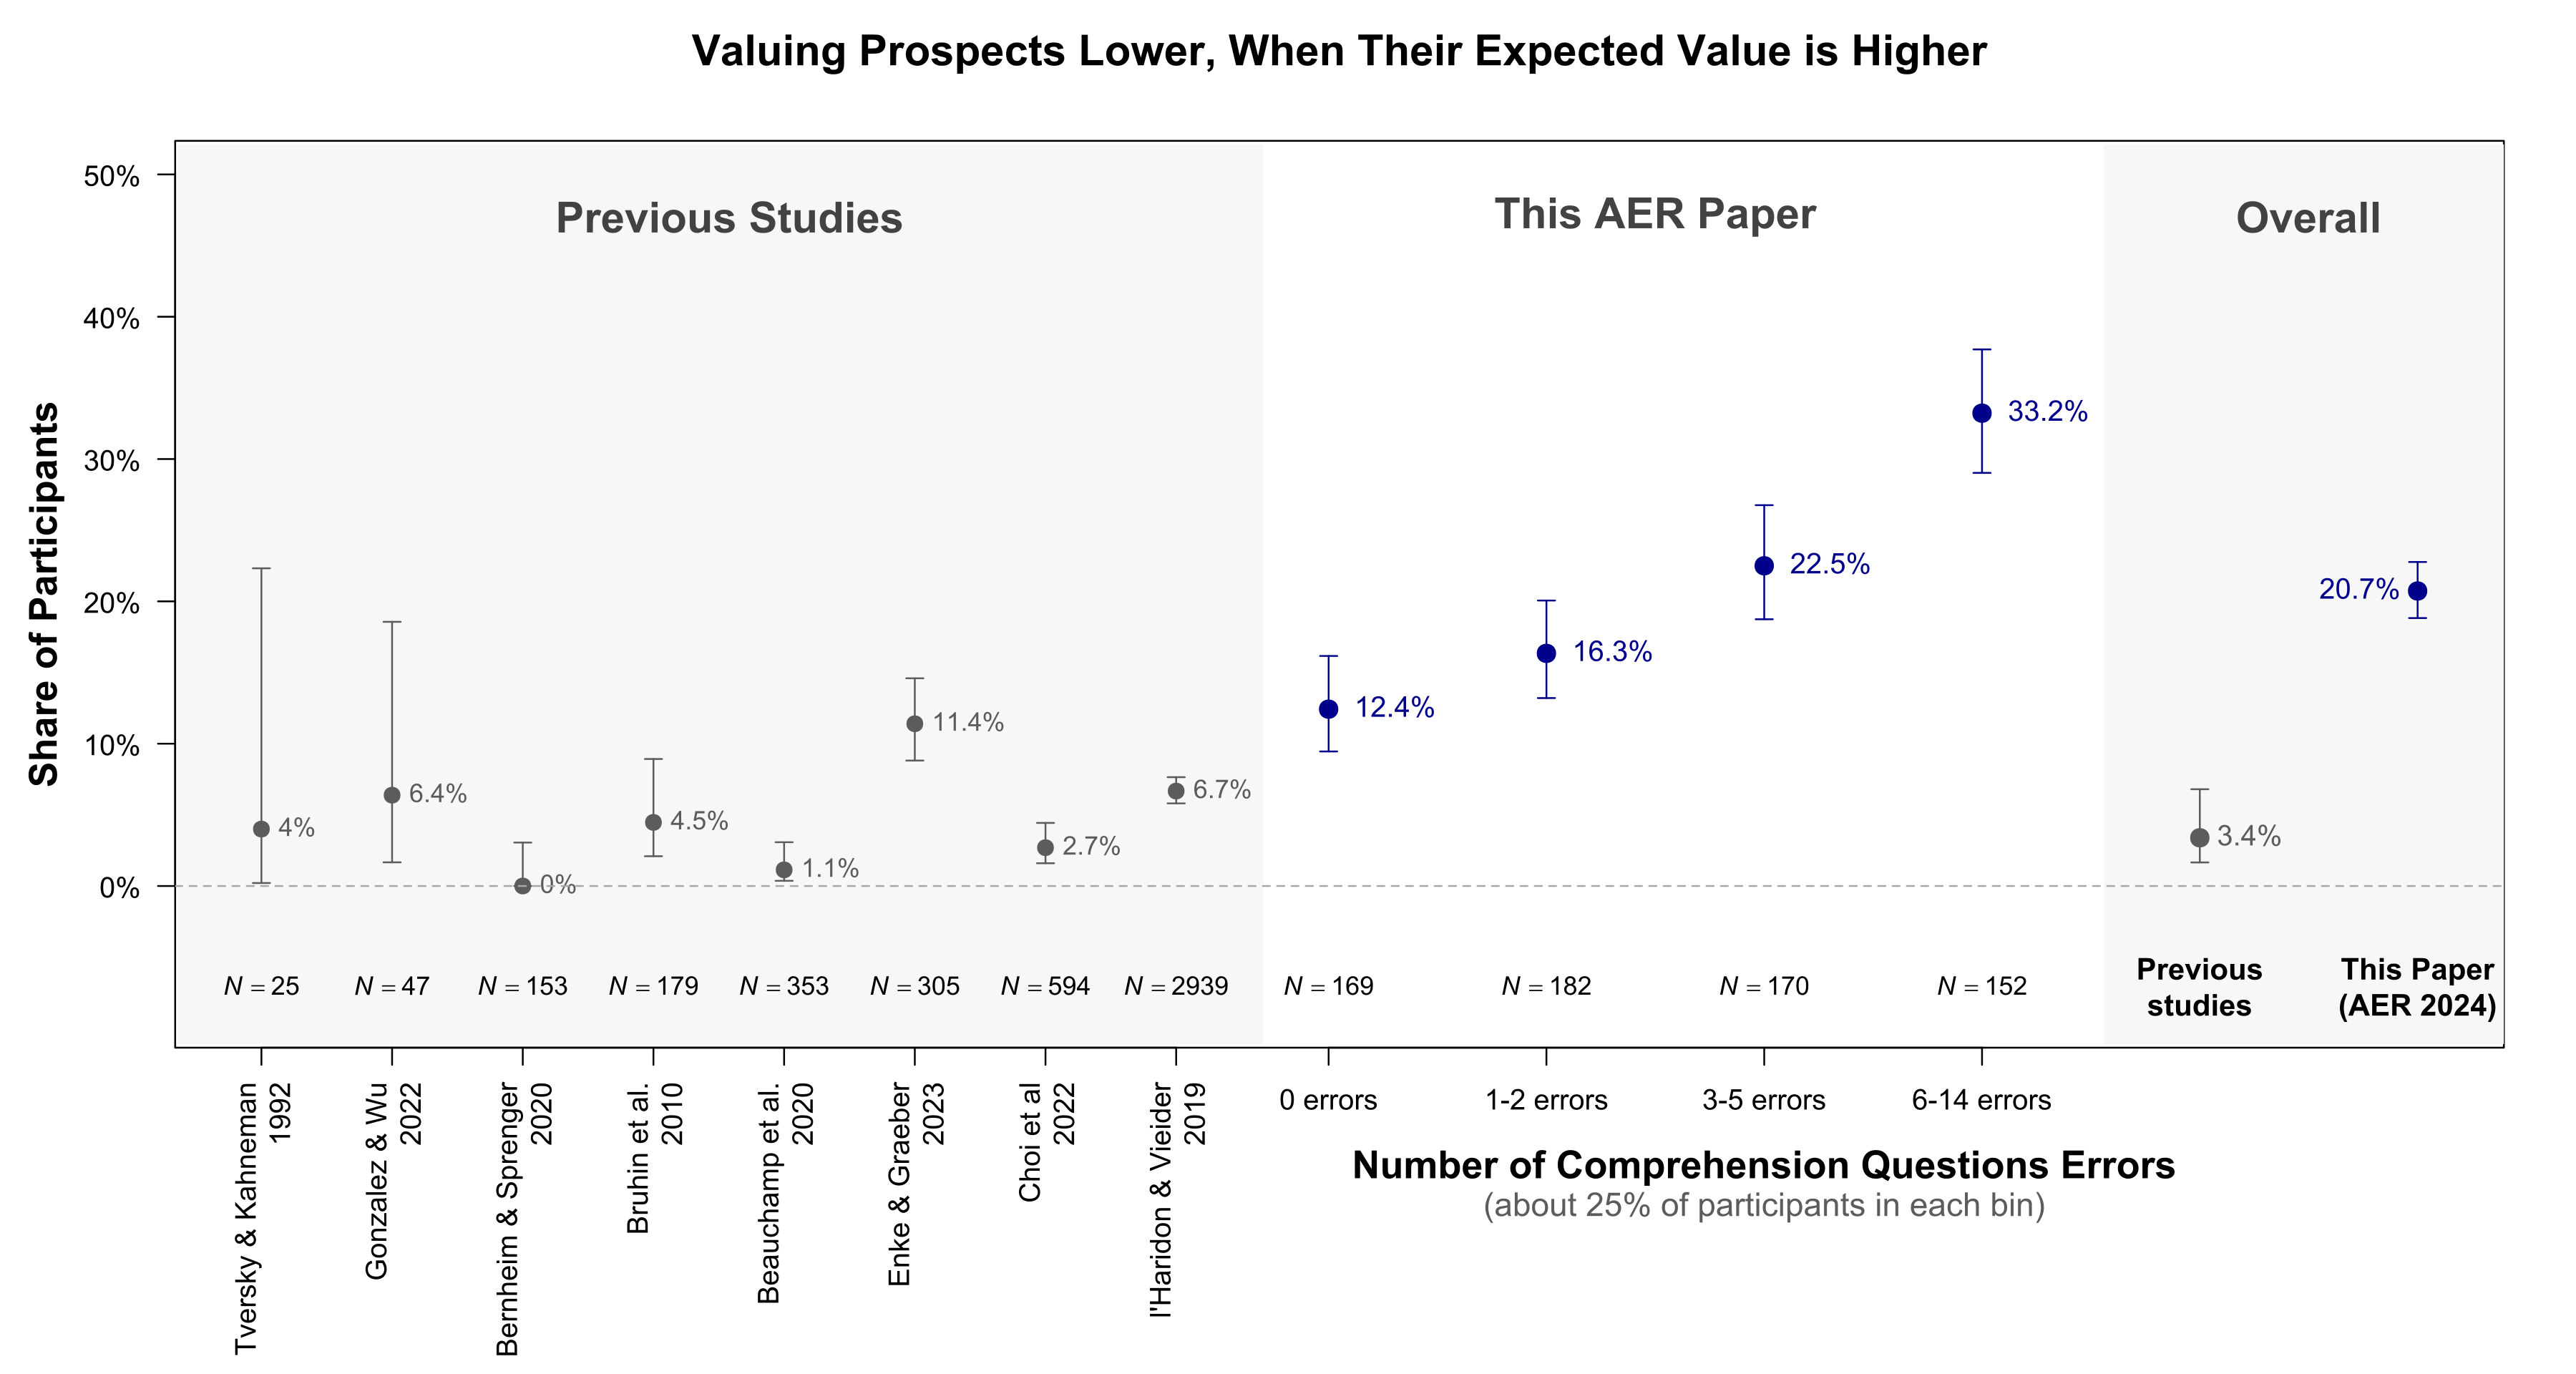
Fig 3. Incoherent responses (e.g., valuing 10% of $25 more than 90% of $25)
If the comprehension questions in the AER paper were intended as training, the data suggests they were insufficient training.
Share of participants showing effects
The figure at the beginning of the post – the one showing that the AER findings go away when looking at participants without errors – depicts medians. We obtain a similar pattern when analyzing the share of participants showing effects. Figure 4 shows the share of participants showing the fourfold pattern predicted by prospect theory, and the share who value the prospects at expected value. As you can see, the majority of participants who exhibited no comprehension errors valued the lotteries in the way that prospect theory predicts and valued mirrors at their expected value. In other words, the people who best understood the task provided valuations consistent with prospect theory and inconsistent with complexity. [4].
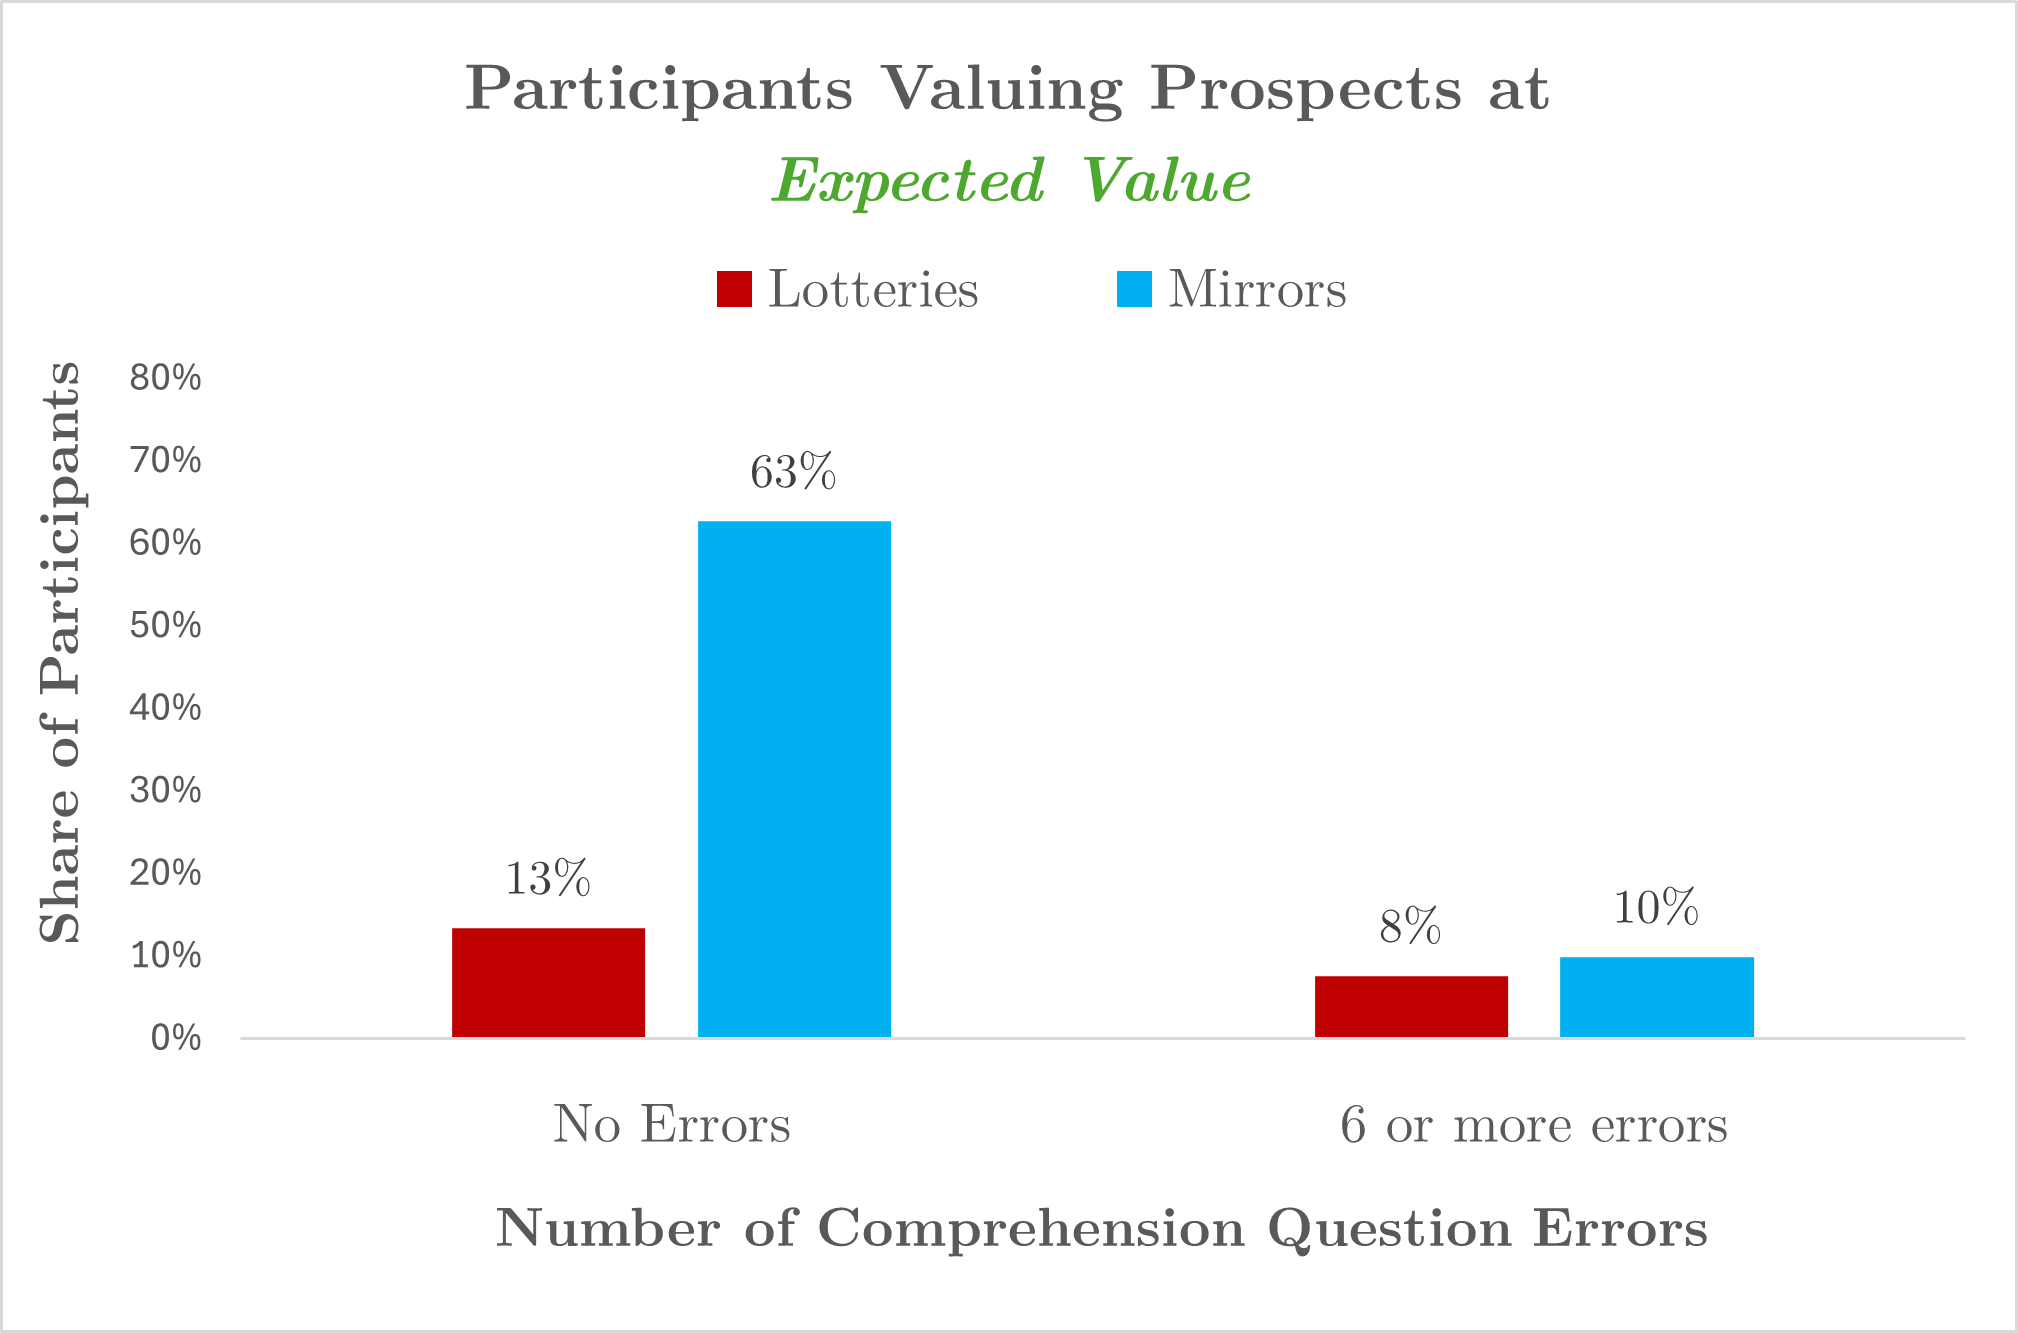
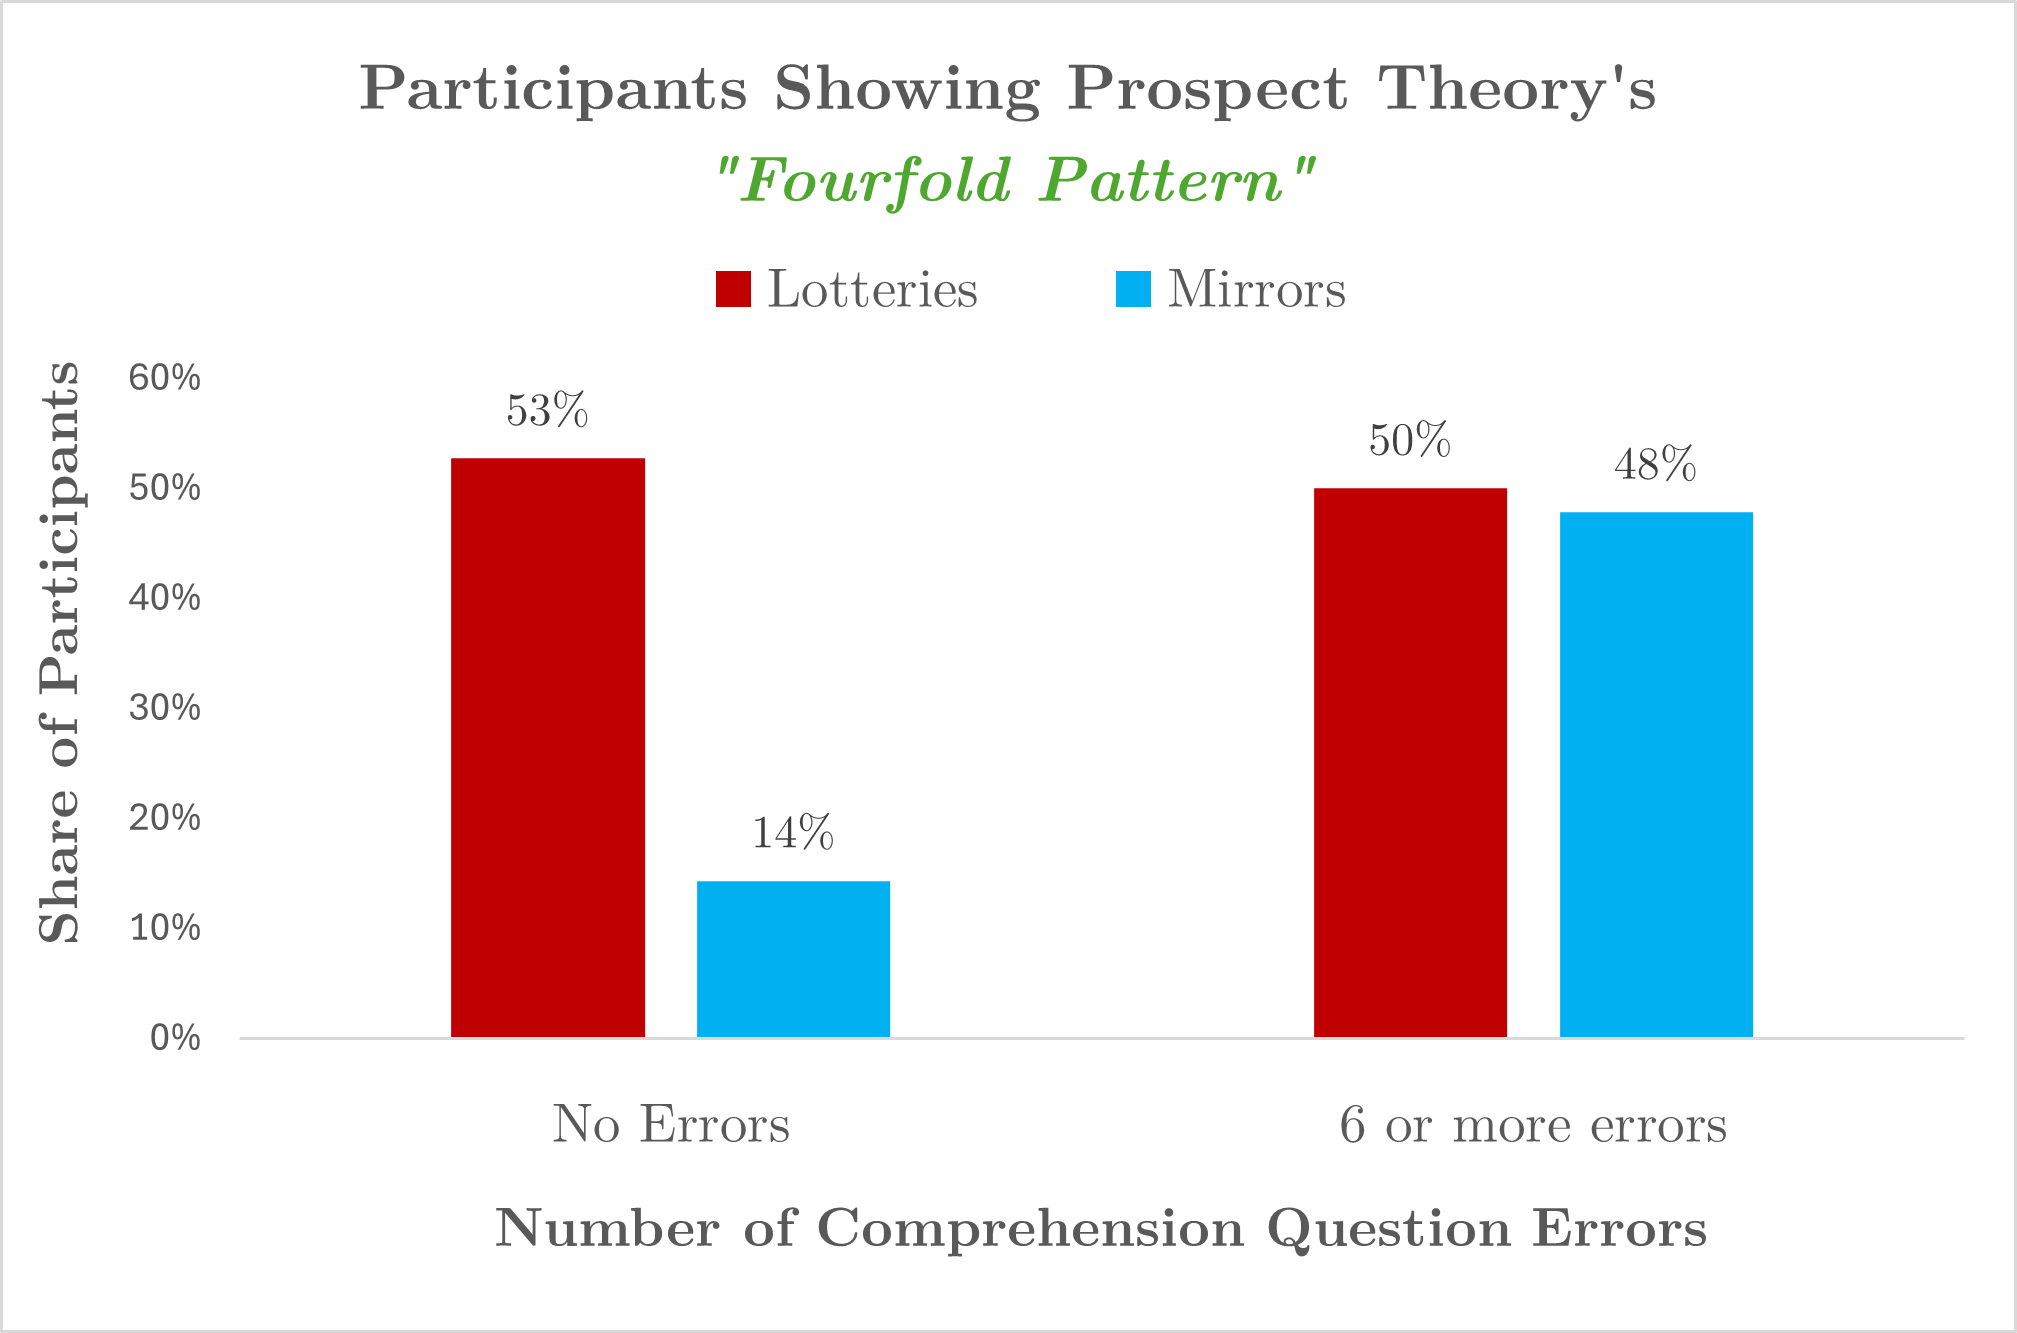
Fig 4. Share of participants valuing mirrors at Expected Value and lotteries in line with Prospect Theory
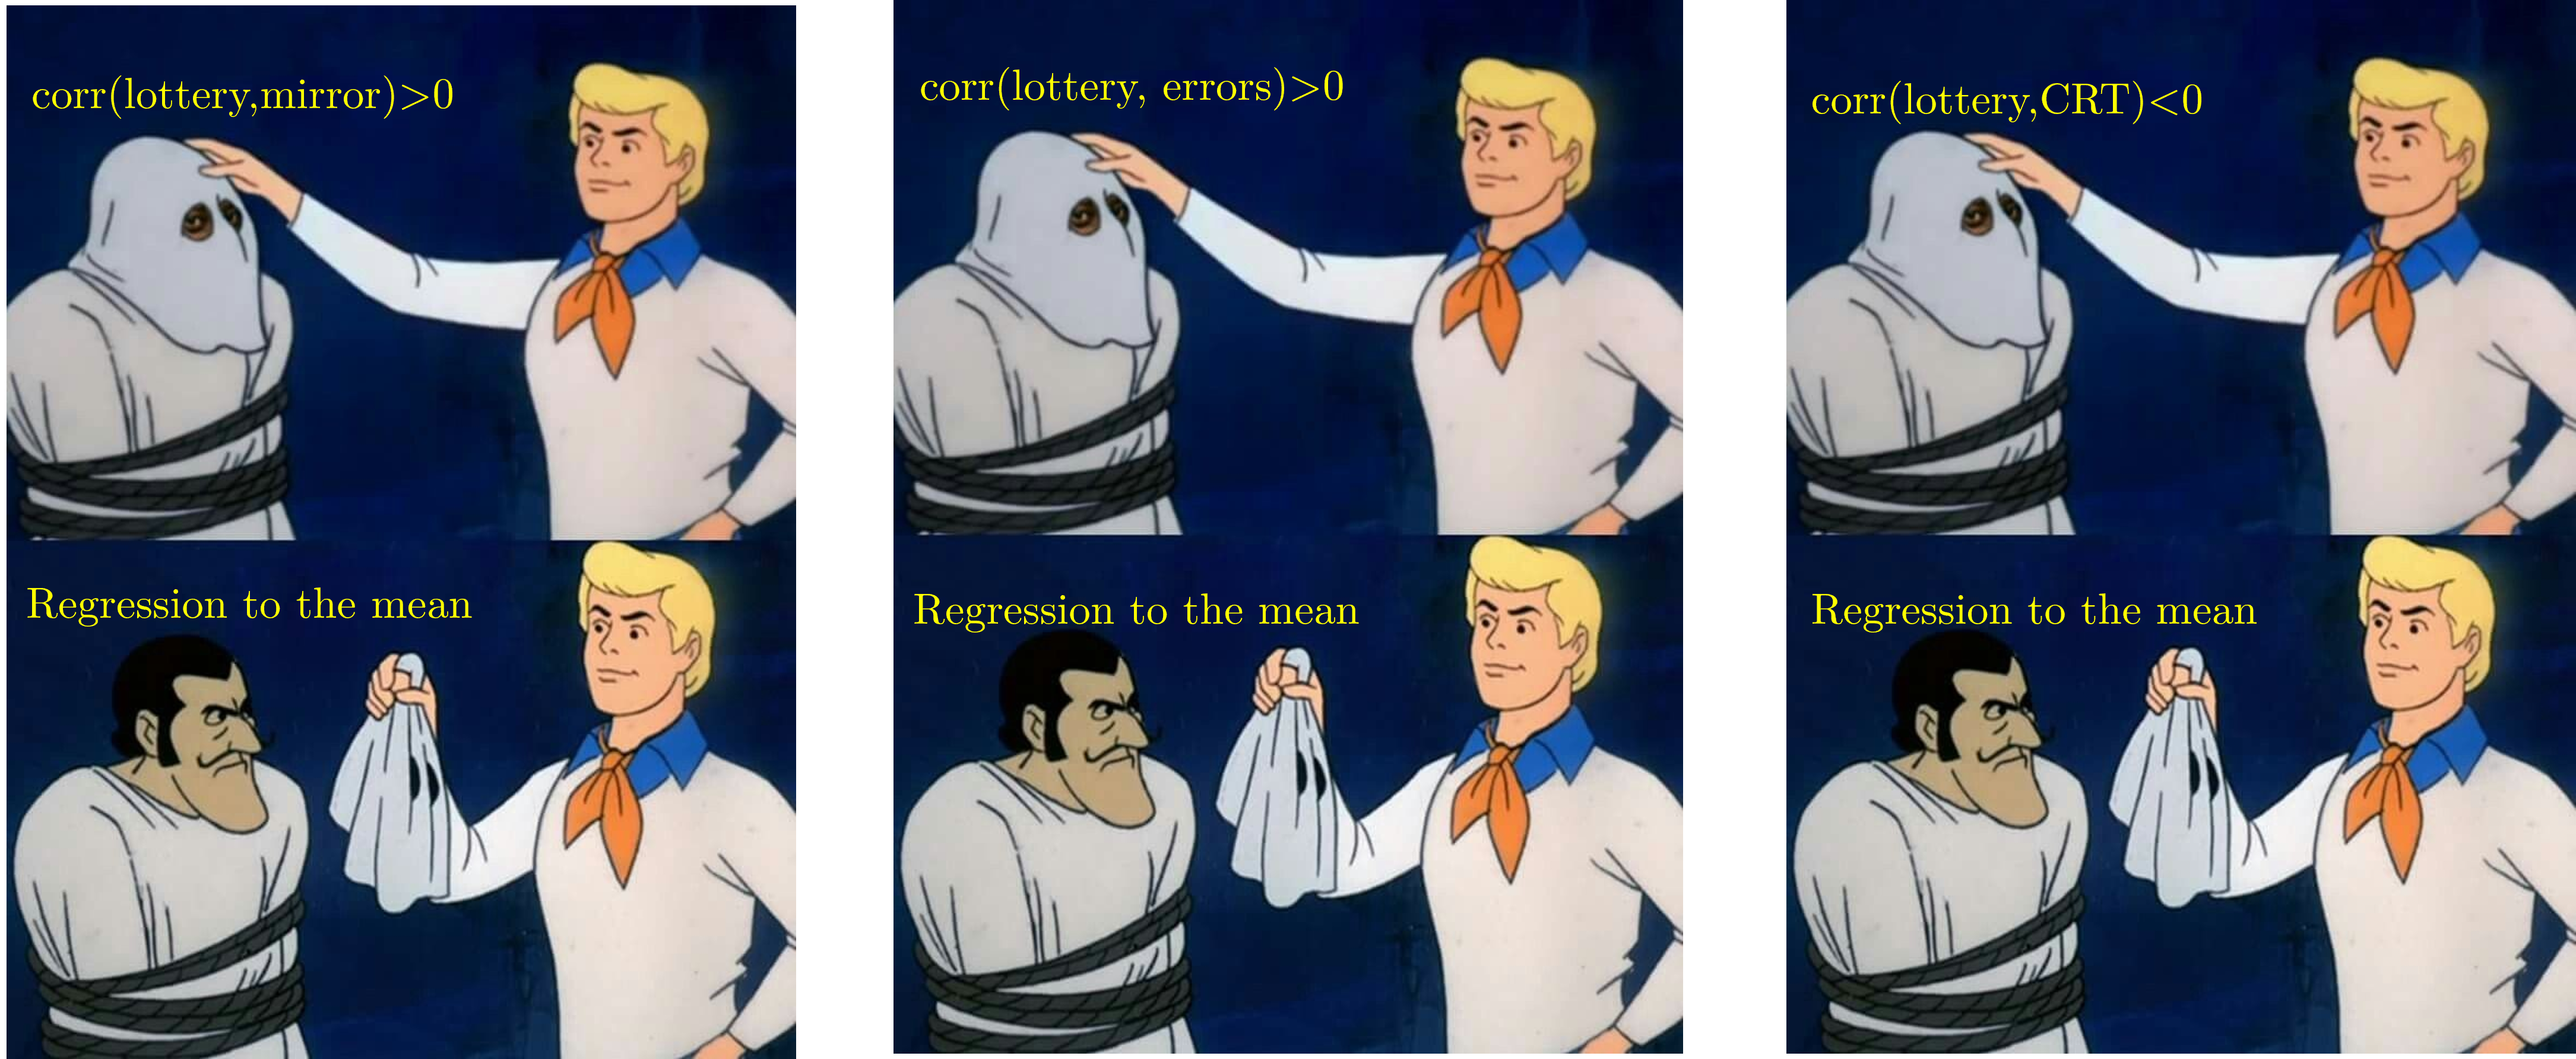
Why do confused participants show prospect theory behavior with mirrors?
First, some participants probably thought the mirrors were lotteries, which can of course cause them to provide similar valuations of lotteries and mirrors. (We have evidence of this in the paper but no space here.).
Second, and less obviously and more interestingly, this can arise because of regression to the mean.
Imagine a clueless participant, someone who never understood the instructions or someone who stopped paying attention after, say, 5 minutes of providing dollar values for sets of imaginary boxes. What would this clueless person do when facing this table?:
A participant who chooses randomly or capriciously will tend to give answers away from the extremes of the scale. This will cause median and (especially) mean valuations towards the midpoint of the scale (henceforth, “regression to the mean” for short). [5]
When the dependent variable is how much people value prospects, regression to the mean creates spurious evidence in line with prospect theory. When people answer randomly for 10% chance of $25, they overvalue it, because the “right” valuation is $2.50, and the scale mostly contains values that are higher than that. When people answer randomly for 90% chance of $25, they undervalue it, because the “right” valuation is $22.50 and the scale mostly contains values that are lower than that. Thus, random or careless responding will produce the same pattern predicted by prospect theory.
One can design a study where regression to the mean works against prospect theory. Kahneman and Tversky did some decades ago, relying on binary choice. Like this:
What do you prefer?
a) $2.50 for sure
b) 10% chance of $25
That’s what an empty backpack looks like.
In this case, random responding biases the estimate towards 50:50, and thus away from prospect theory predictions. The “Asian Disease problem”, for example, the most famous instantiation of the kind of risk preference reversals studied in this AER paper, relies on simple binary choice. [6]
George Wu just posted on SSRN the results from a binary-choice experiment contrasting lotteries with mirrors, finding big differences in how mirrors and lotteries area valued (.htm). The design and analyses would take some time to explain, so here I just highlight an interesting result:
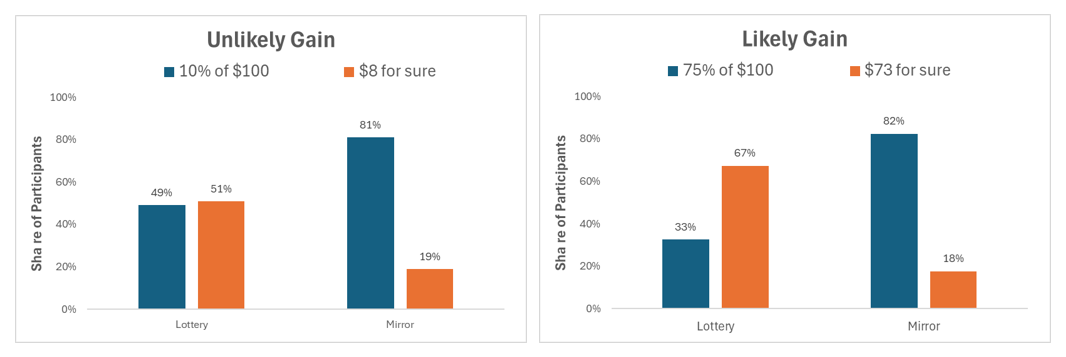
Fig 5. Highlighted results from new study by George Wu, available on SSRN (paper: htm | his Figure 4 ,pdf)
Though the results aren’t perfect for prospect theory, e.g., only half the people took the 10% lottery, with lotteries we do see more risk seeking with unlikely gains that with likely gains; while with mirrors there is no difference. Notably: (1) random responding cannot explain the lottery results, and (2) lotteries are treated quite differently from mirrors.
Regression to the mean is probably behind two other results
The AER paper highlights two correlations as key results: (1) the effect size for lotteries and mirrors is correlated across participants, which is interpreted as showing the same mechanism drives both effects (‘complexity’) (2) more sophisticated people (e.g., STEM majors, high CRT people) show smaller effects, which is interpreted as showing the mechanism involves making cognitive mistakes smart people avoid.
Regression to the mean may offer a simpler explanation.
To see how regression to the mean is at play, let’s look at the raw valuations of mirrors and lotteries for 10% of $25.
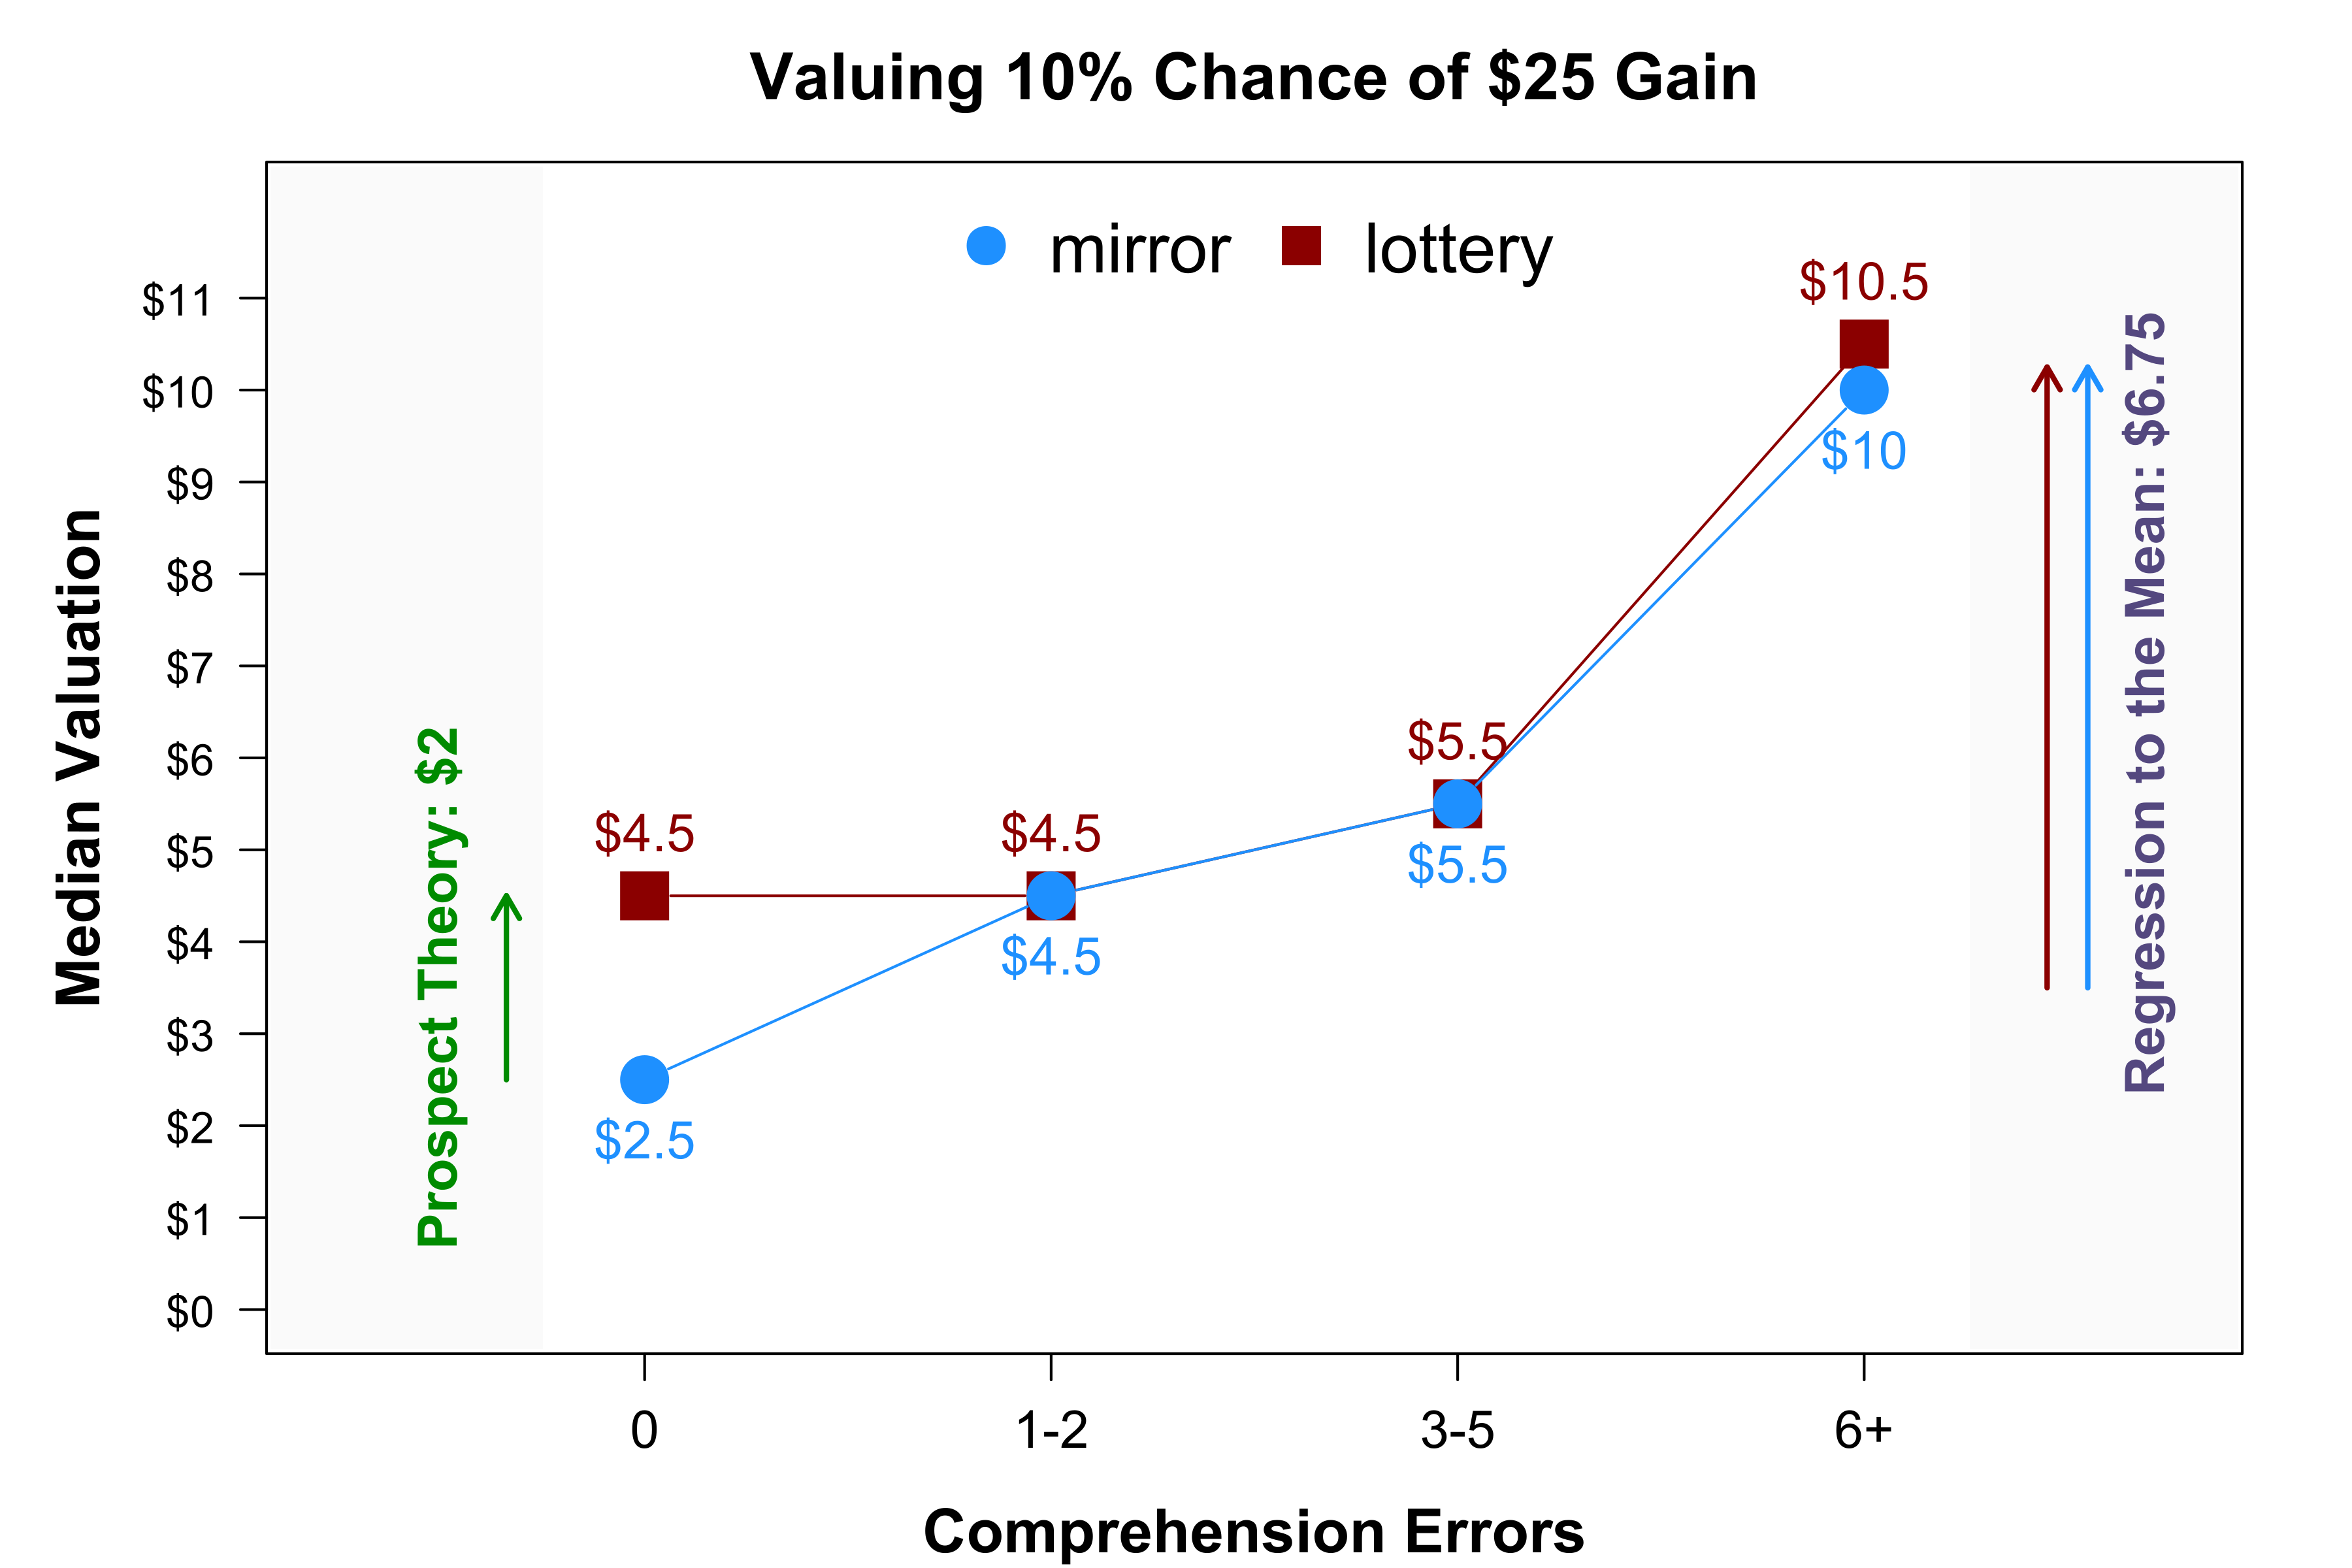
Fig 6. Correlation in lotteries and mirrors seems driven by regression to the mean
Starting from the left, we see that the median participants who had zero comprehension errors valued mirrors at expected value and lotteries above it, as predicted by prospect theory. As we move right, both medians go up, way up. The AER paper suggests that we should think of that variation as showing higher and higher valuations of the prospect, but that variation confounds noise with signal, regression to the mean, with the true underlying valuation of mirrors and lotteries (FWIW, I’d say that valuing a 10% chance of $25 at $11 is not consistent with prospect theory, it’s too high an over-valuation).
If we compute the vertical difference in valuations, between mirrors and lotteries, we partial out some of that randomness (econ friends, think: diff-in-diff instead of diff). Participants with no errors show a pattern consistent with prospect theory, but the other participants do not.
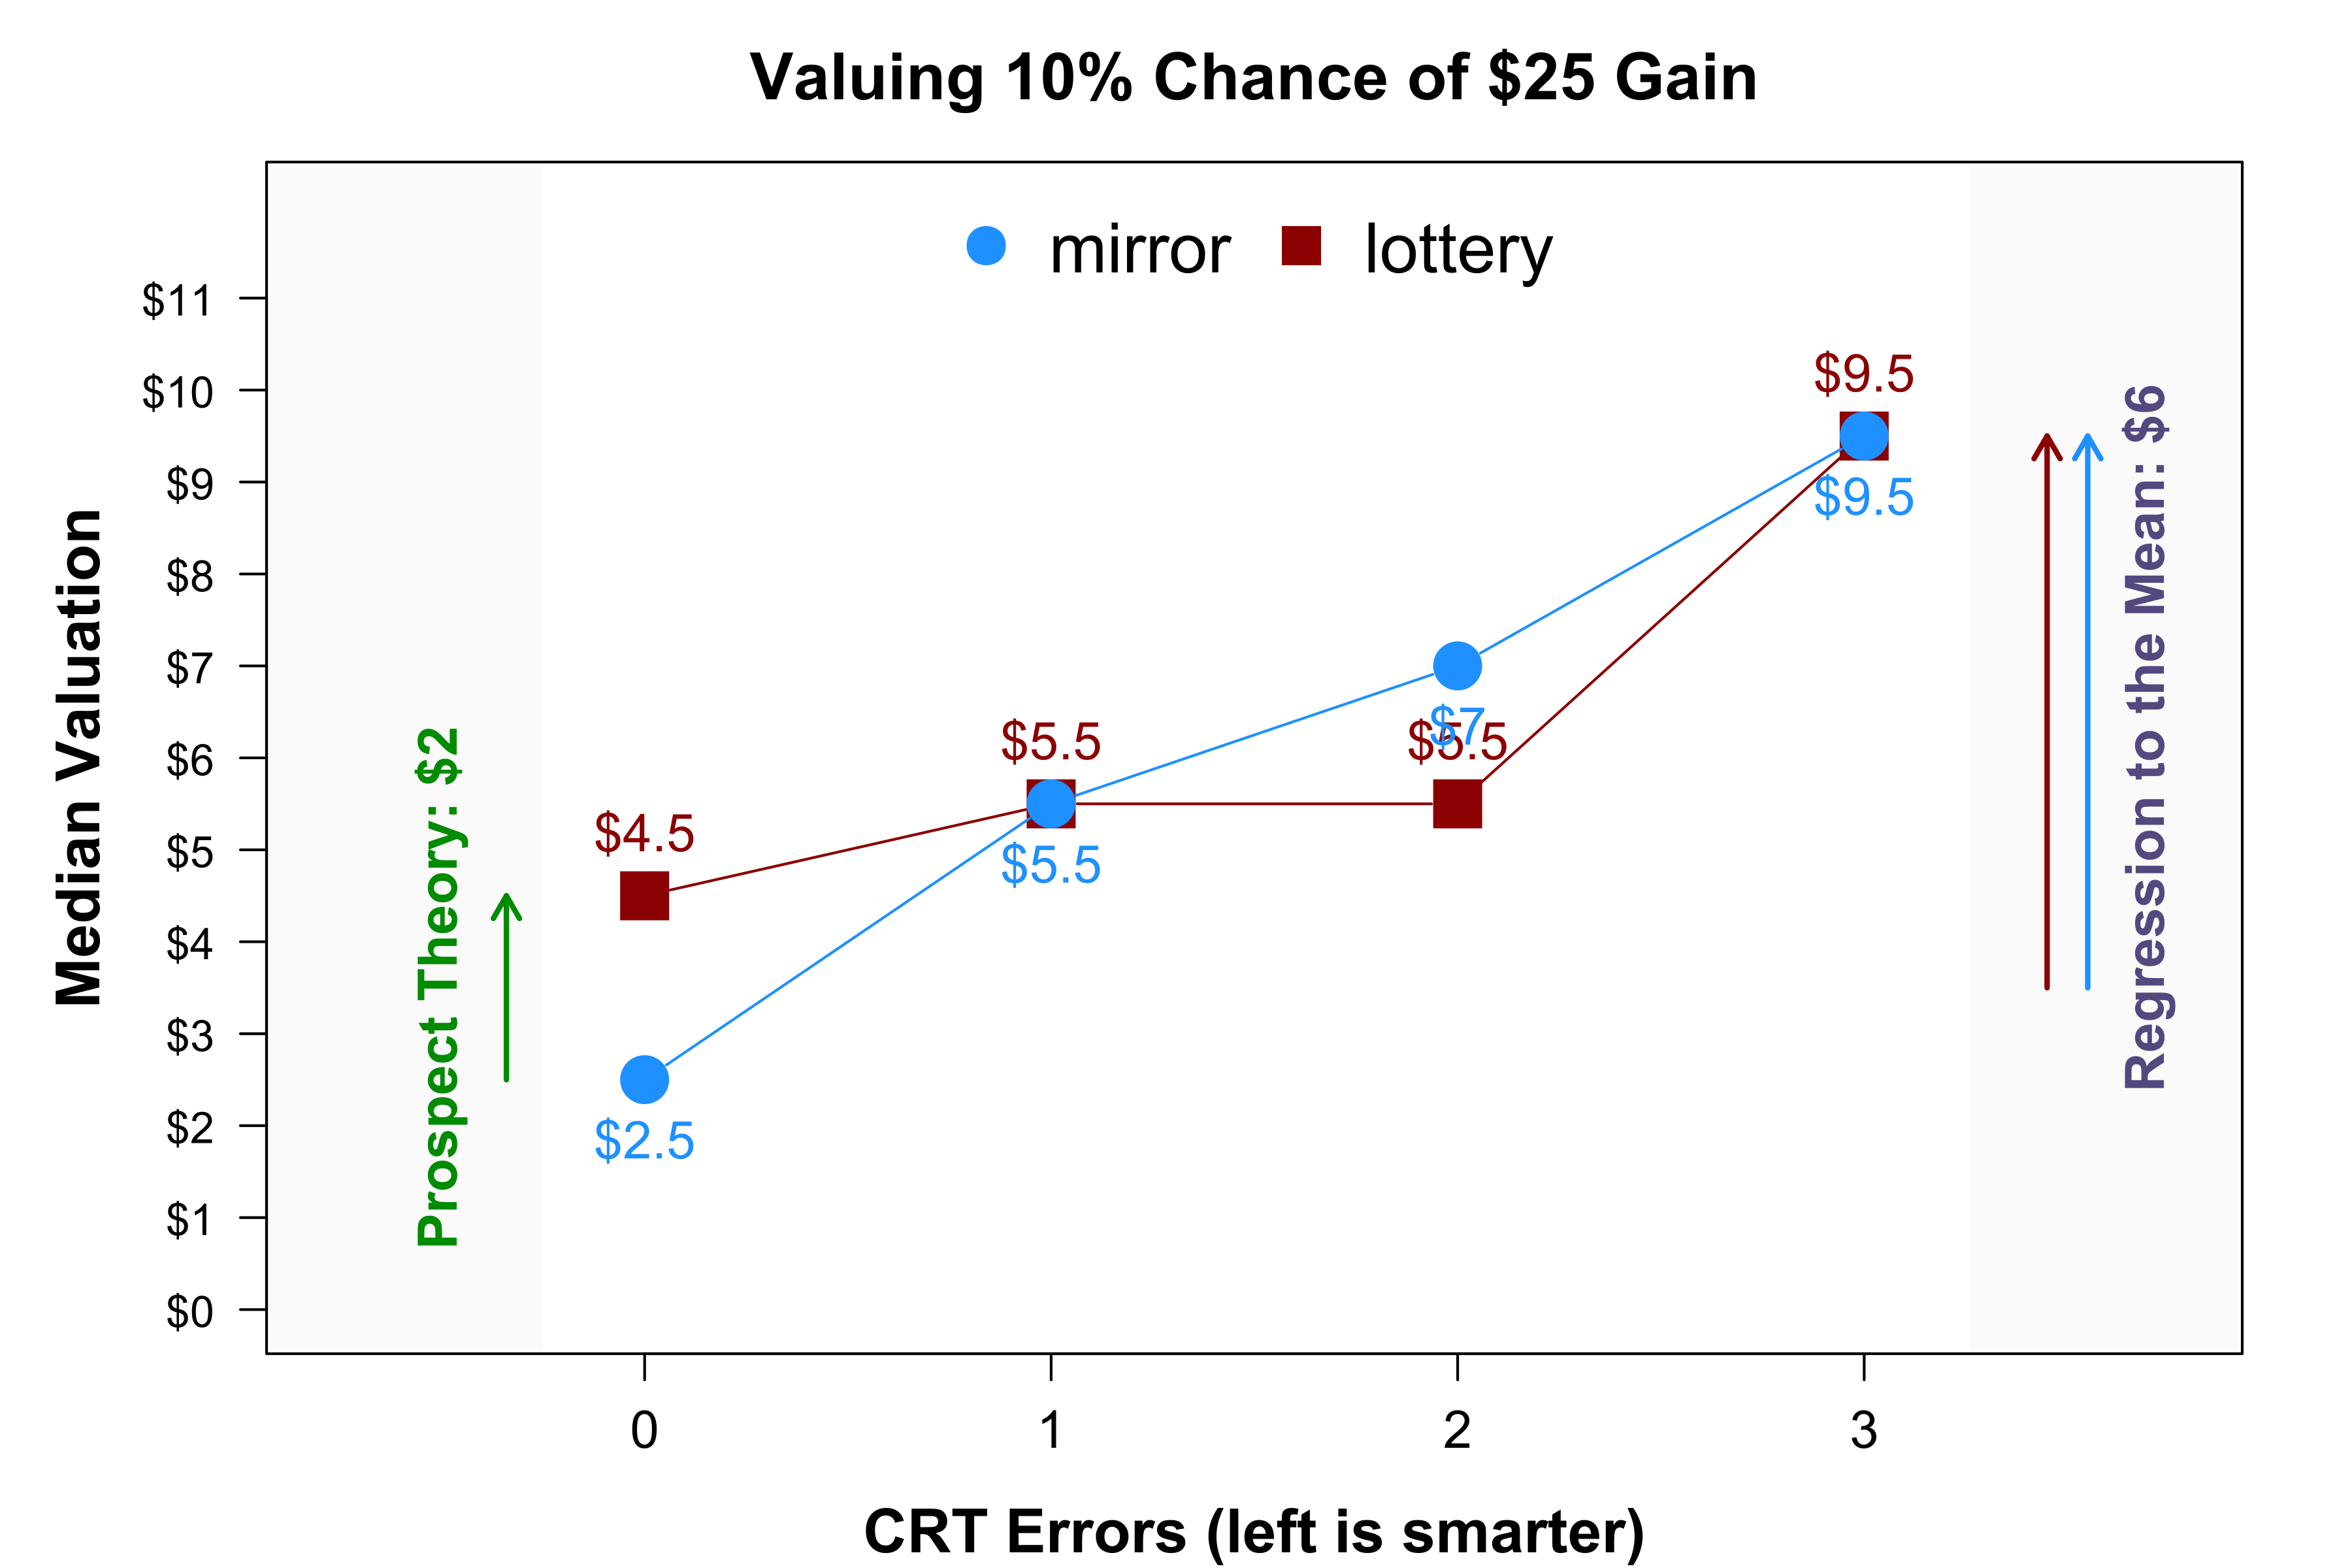
A similar logic applies to the correlations with cognitive sophistication (e.g., STEM or CRT).
Two things need to be true.
The AER paper argues that past studies showing support for prospect theory actually reflect participants making mistakes because of lottery complexity. Two things would need to be true about the data in the AER paper for this inference to be justified, and neither is.
First, it needs to be true that the level of confusion in the AER studies is comparable to the level of confusion in past studies. But, Figure 3 shows it is not true. Incoherent respondents are 6 times more common in the AER studies.
Second, it needs to be true that people who understood the lotteries do not show behavior in line with prospect theory. But Figures 1, and 5-7 of this post show this is not true. The more people understood the experiment, the more they treated lotteries and not mirrors in line with prospect theory predictions.
![]()
Disclaimer: two economists who read the SSRN paper thought we should explicitly indicate no misconduct is suspected. To be clear: there is zero concern of academic misconduct. To avoid other possible misreadings I want to also indicate I am not suggesting the AER paper insufficiently controlled for weather variables (Colada[46]), I am not suggesting it should have included interaction controls (Colada[80]), and I am not suggesting the AER author takes baths in hotel rooms (Colada[16]).
Author feedback
Our policy (.htm) is to share drafts of blog posts with authors whose work we discuss, in order to solicit suggestions for things we should change prior to posting.
We had sent the SSRN paper to Ryan Oprea, the author of the AER paper, before posting it there, and I sent a draft of this post to him as well, about a month ago. Ryan and I exchanged many emails over the past few weeks. I want to start with some bad news for Devin Pope, who I have now demoted (in my mental ranking) to being the second nicest economist.
I summarize below what I believe are the key points of agreement and disagreement with Ryan. I shared this summary with him, he provided comments, which I interleave below behind links like this one:
You can also read his full separate response to the post here: pdf Three points we agree on 2. With some experimental designs, measurement error can masquerade as the effect of interest to the researchers, e.g., people may over-pay for a 10% chance of $100 not because they value it more than $10, but because they didn’t think it through and just chose the midpoint of the scale, say $50, pushing the mean above the expected value of $10. This would constitute spurious evidence of the phenomenon of interest, probability weighting, and it would just be measurement error. 3. Experimenters in the past have paid insufficient attention to the potential role of measurement error in their findings. What we disagree on The key issue in my mind is that Ryan’s studies are much more confusing that past studies were, and thus produced lots more measurement error. If we think of his studies as a sample used to estimate measurement error in past studies, we should think of it as an unrepresentative sample. This is not just because when I read Ryan’s instructions they seem confusing to me, it is not just because mirrors are a weird contraption that I believe participants did not understand and many confused with lotteries, but because his data objectively show higher levels of confusion than in past studies. In his data, for instance, participants valued prospects incoherently (e.g., paying more for 10% chance of $25 than for 90% chance of it), about 6 times as often as they did in past studies. I don’t think the behavior of participants in a categorically more confusing study can inform the interpretation of behavior from participants in past studies. Moreover, focusing on participants who presumably have the least measurement error in Ryan’s data (e.g., those with perfect scores in comprehension question or in the CRT), we find substantive evidence in line with prospect theory for lotteries, but not for mirrors. This in my mind speaks actively against the hypothesis that measurement error explains evidence of risk preferences in line with prospect theory. Shortly before this blogpost went live, Ryan shared with us a his response to our SSRN paper (.pdf) Footnotes
1. Some participants in experiments find it too hard or unpleasant to work through what expressing their true preferences (or beliefs) would entail and instead do something else, that something else may be an artifactual heuristic, responding randomly, etc. Ryan frames this a complexity, as in, the complexity involved in providing the answer expected by the experimenter gets in the way. I will refer to this as measurement error.
While I agree with points 1-3 as theoretical concerns, I think it is ultimately an empirical question whether measurement error accounts for a substantial share of empirical patterns attributed to prospect theory in past studies. While Ryan’s paper proposes that his data show that past results are mostly or entirely the result of measurement error, I believe his data do not show that. I believe they show that measurement error plays a huge role in his studies, and actually suggest measurement error played a much smaller if any role in past studies.