In this sixth installment of Data Replicada, we report our attempt to replicate a recently published Journal of Consumer Research (JCR) article entitled, “The Impact of Resource Scarcity on Price-Quality Judgments” (.html).
This one was full of surprises.
The primary thesis of this article is straightforward: “Scarcity decreases consumers’ tendency to use price to judge product quality.” It reports six studies, three of which were conducted on MTurk. We chose to replicate Study 2A (N = 149) because it was the MTurk study with the strongest evidence, and because it also tested the effects of scarcity on two other measures: desire for abundance and categorization tendency (described below).
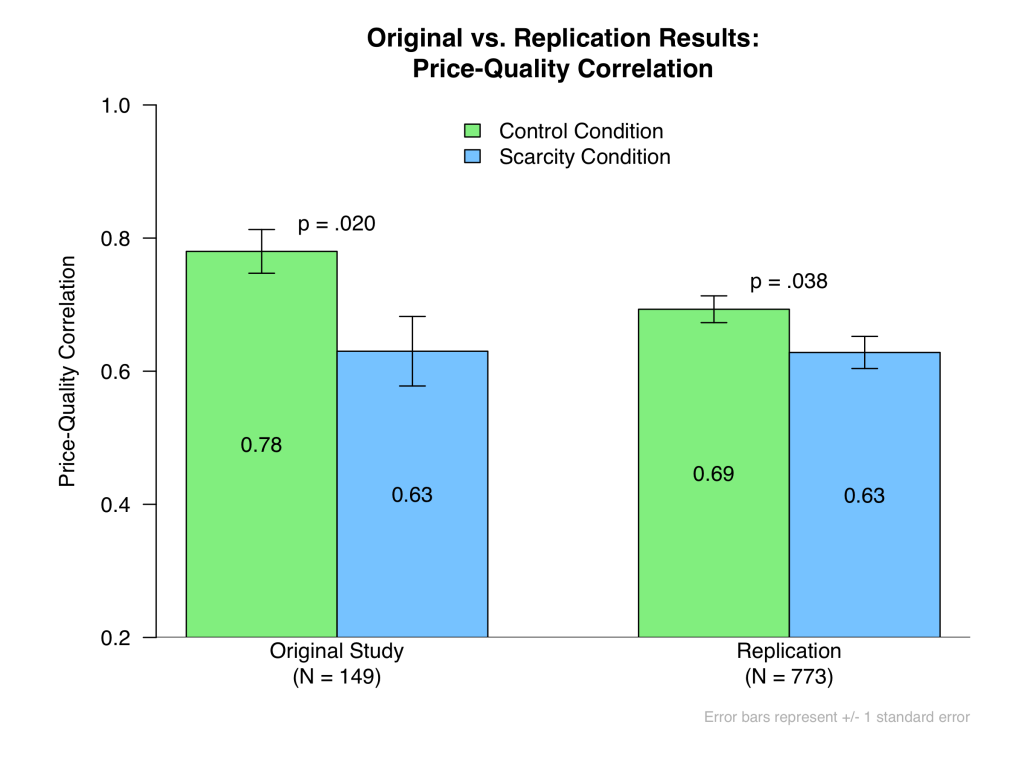
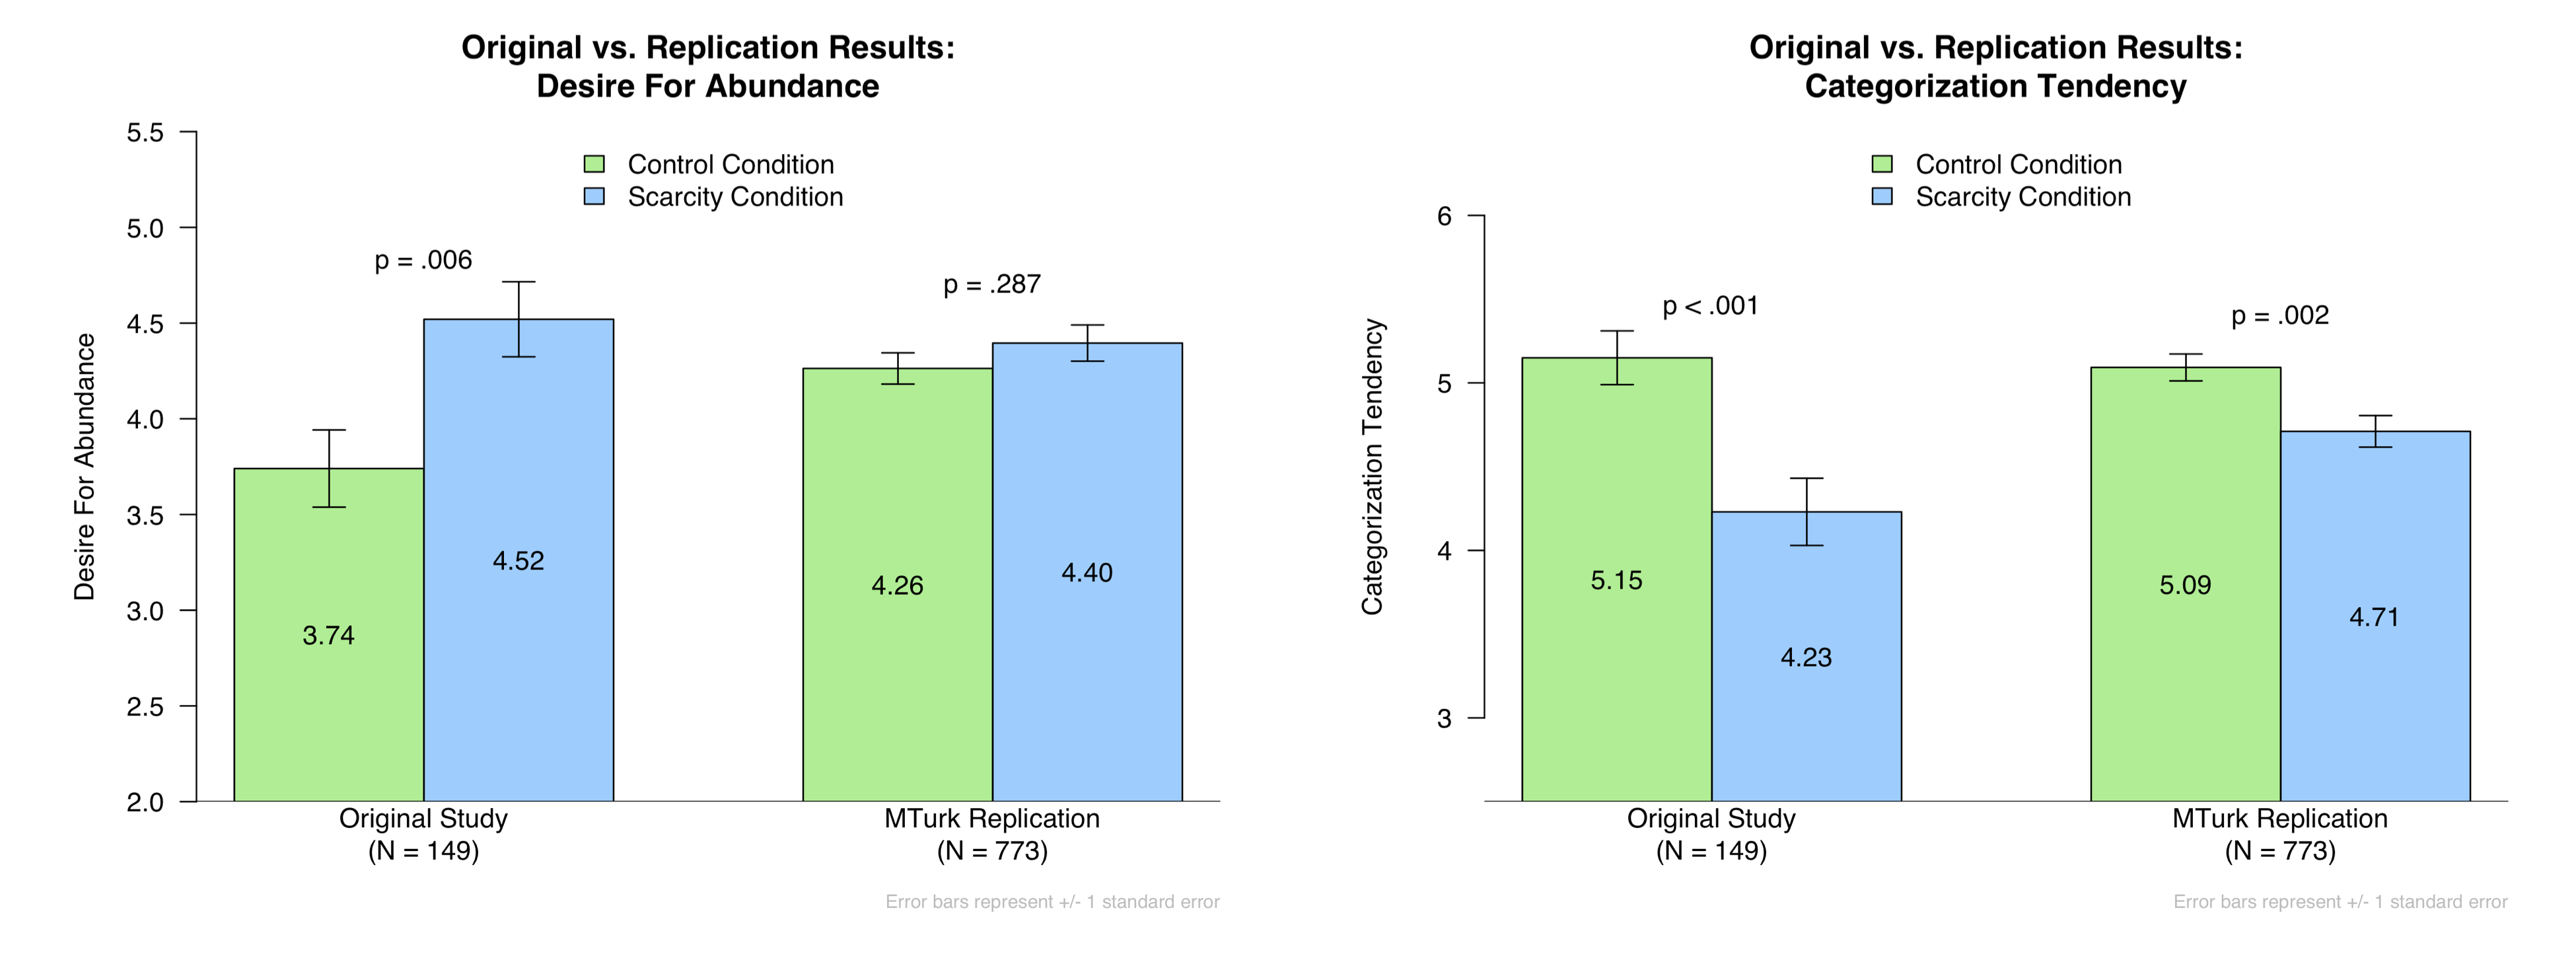
In this study, participants were randomly assigned to complete a writing task that was designed to either induce a feeling of scarcity or not. They then rated their desire for abundance, completed a task designed to measure their categorization tendency, and then judged the quality of 10 computer monitors based solely on their prices. The estimated correlation between price and quality served as the authors’ primary dependent variable. Writing about scarce resources increased the desire for abundance (p = .006), lowered categorization tendency (p < .001), and, most importantly, reduced the judged correlation between quality judgments and prices (p = .020) [1].
We contacted the authors to request the materials needed to conduct a replication. Unfortunately, the first author could not locate the original Qualtrics file, but he did send us a document containing a detailed summary of the methods. In general, the authors were forthcoming and polite, doing their best to answer all of our questions about how to best design our replication. We are very grateful to them for their help and professionalism.
The Replication
In our replication, we tried our best to follow the procedures the authors outlined for us. There were, however, necessarily a few deviations, which we detail in this footnote: [2]. Also, in collaboration with the original authors, we tried our best to use exclusion criteria that made sense. You can access our Qualtrics surveys here (.qsf), our materials here (.pdf), our data here (.csv), our codebook here (.xlsx), and our R code here (.R).
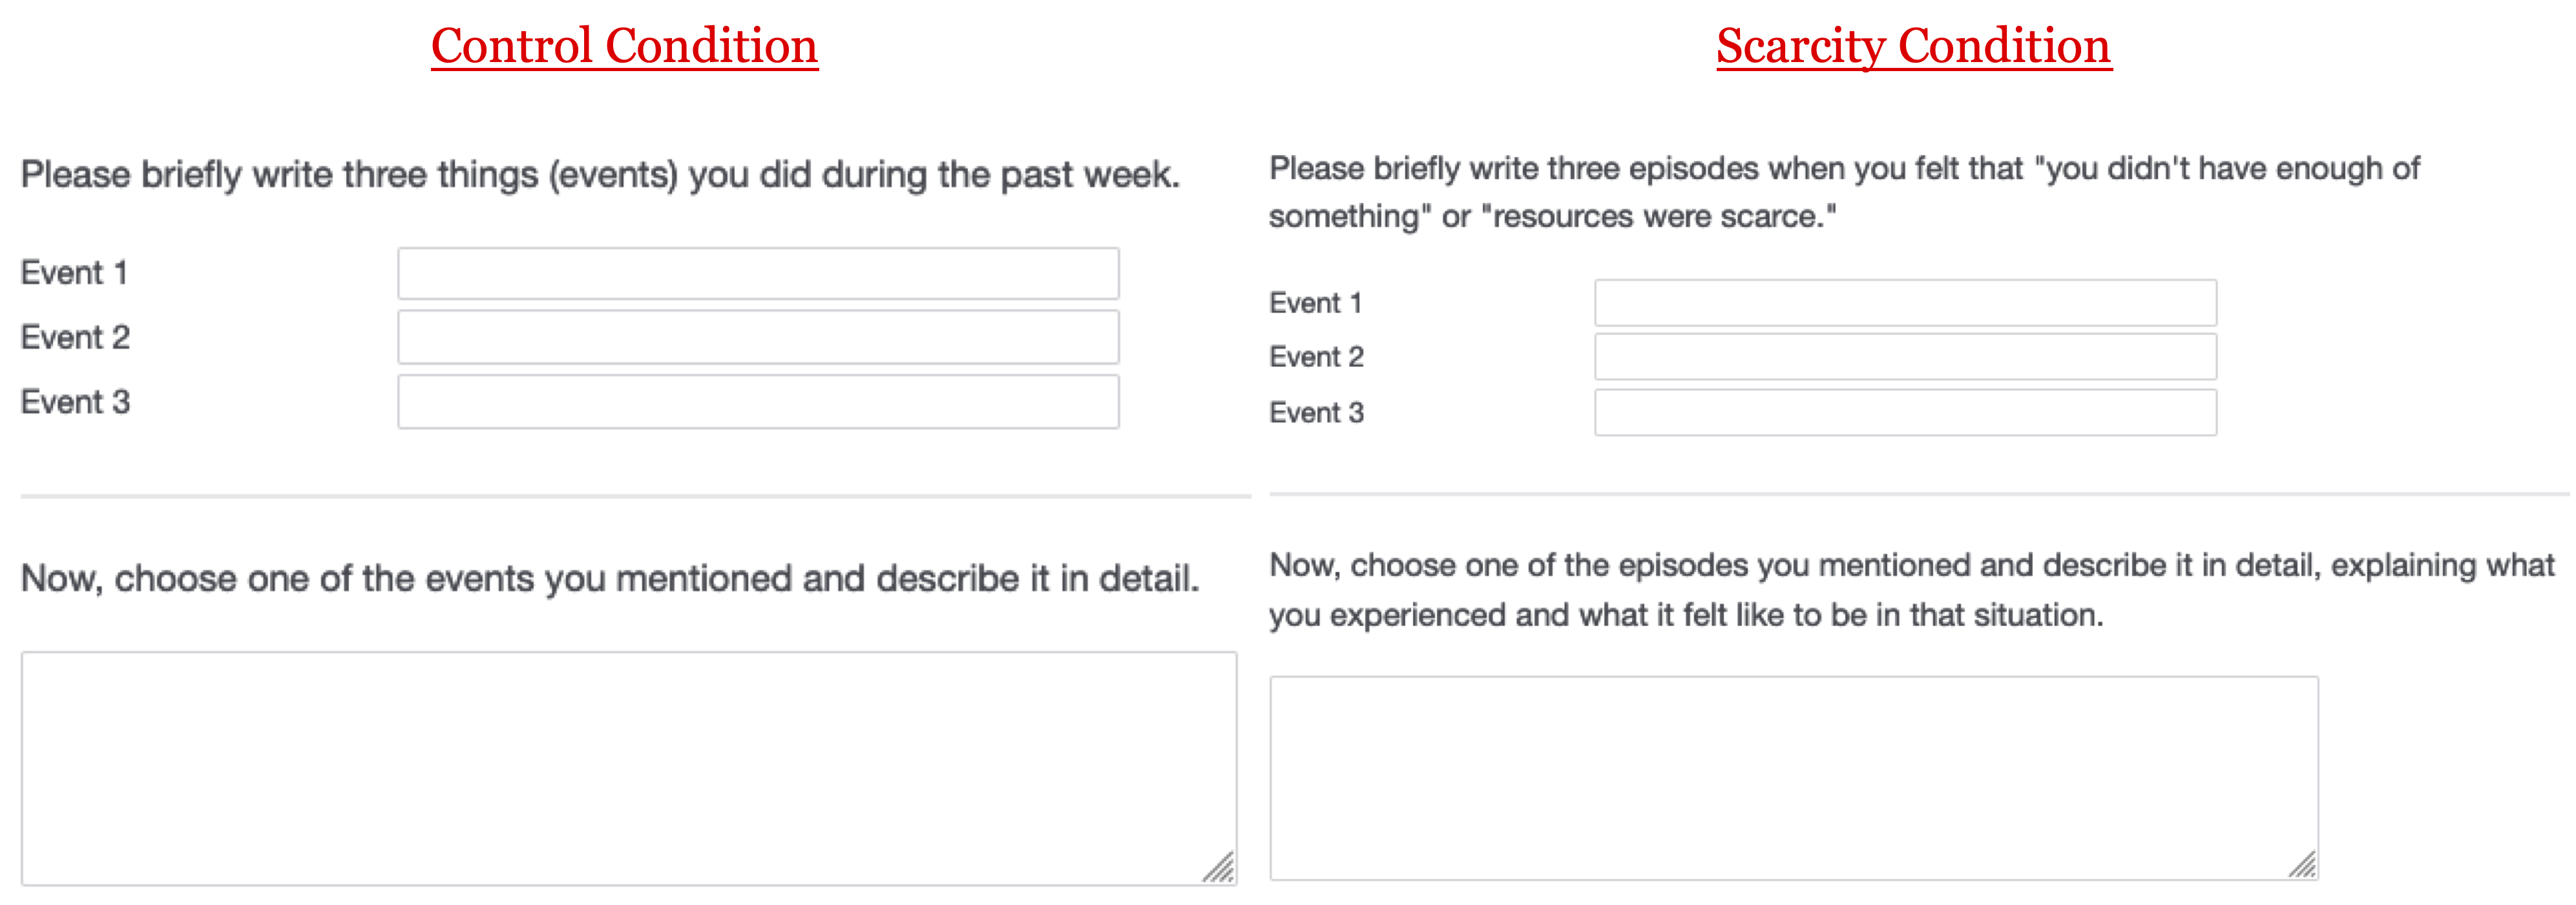
In this study, participants began by completing a writing task borrowed from Roux, Goldsmith, and Bonezzi (2015; .pdf). This served as the critical manipulation of scarcity. You’re going to want to look at this manipulation closely, because it affected participants in surprising ways:
After completing this task, participants completed three dependent measures.
Measure #1: Desire For Abundance
First, we measured their Desire For Abundance, which consisted of three items rated on a 7-point scale (1 = Not at all; 7 = Definitely). Those items were: “I desire to have a lot of things”, “I desire to own a lot of things”, and “Having a lot of things makes me happy.” These ratings were averaged.
Measure #2: Categorization Tendency
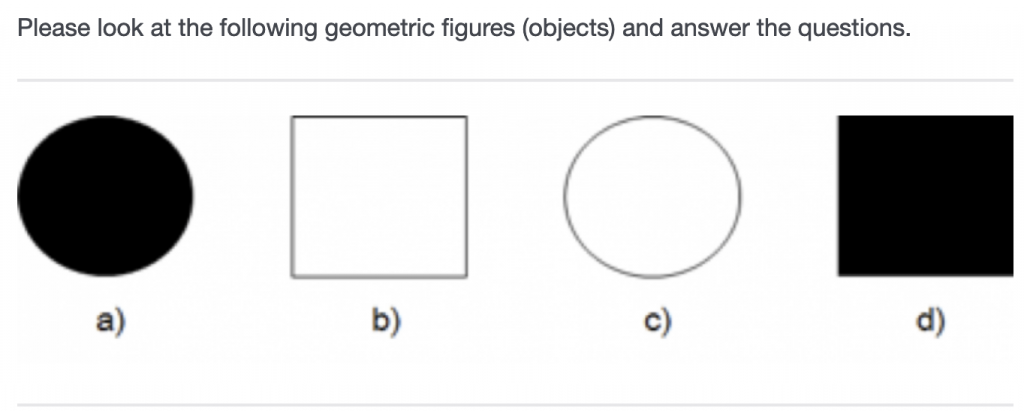
Participants then completed a measure that the authors dubbed “Categorization Tendency.” To assess this, participants were first shown these four shapes:
They were then asked to rate how much they agreed or disagreed with the following statements (1 = Strongly Disagree and 7 = Strongly Agree):
- I would not group object a) with either c) or d).
- I would not group object d) with either a) or b).
- Object d) is dissimilar to both a) and b).
- Object a) is dissimilar to both c) and d).
Responses to these four statements were reverse-coded and then averaged, so that higher scores indicated a greater tendency to disagree with them.
Before moving on, and to foreshadow some of what comes next, it is worth thinking about what this measure is capturing. On the one hand, it might represent a meaningful measure of a person’s tendency to categorize things. On the other hand, it might operate as an attention check, as it is arguably strange for a person who comprehends these statements to strongly agree with them. For example, it is arguably strange to strongly agree that a black square is dissimilar to both a black circle and a white square. Indeed, the modal response to all four statements was “Strongly Disagree,” while the least popular response was “Strongly Agree.”
Measure #3: Price-Quality Correlation
After completing the categorization task, participants were asked to rate the quality of 10 computer monitors given only their prices. Each monitor was displayed on its own screen. Here’s what it looked like:

There were 10 monitors, all priced differently. The prices, which were presented in one of four possible random orders, were $75, $99, $165, $190, $260, $295, $325, $330, $345, and $460. The key measure in this study was the within-subject correlation between participants’ quality ratings and the monitors’ prices [3].
Replication Results
As in the original study, those who did the Scarcity writing task exhibited a lower price-quality correlation than those who did the Control writing task. This effect was much smaller than in the original study – dreplication = .15 vs. doriginal = .42 – but it was nevertheless significant:
 In addition, although the writing task did not significantly influence Desire For Abundance (d = .08), it did have a very significant effect on Categorization Tendency (d = .22):
 So although our observed effects were much smaller than in the original study, this looks like at least a partial success. . .
Except, there is a very big problem:
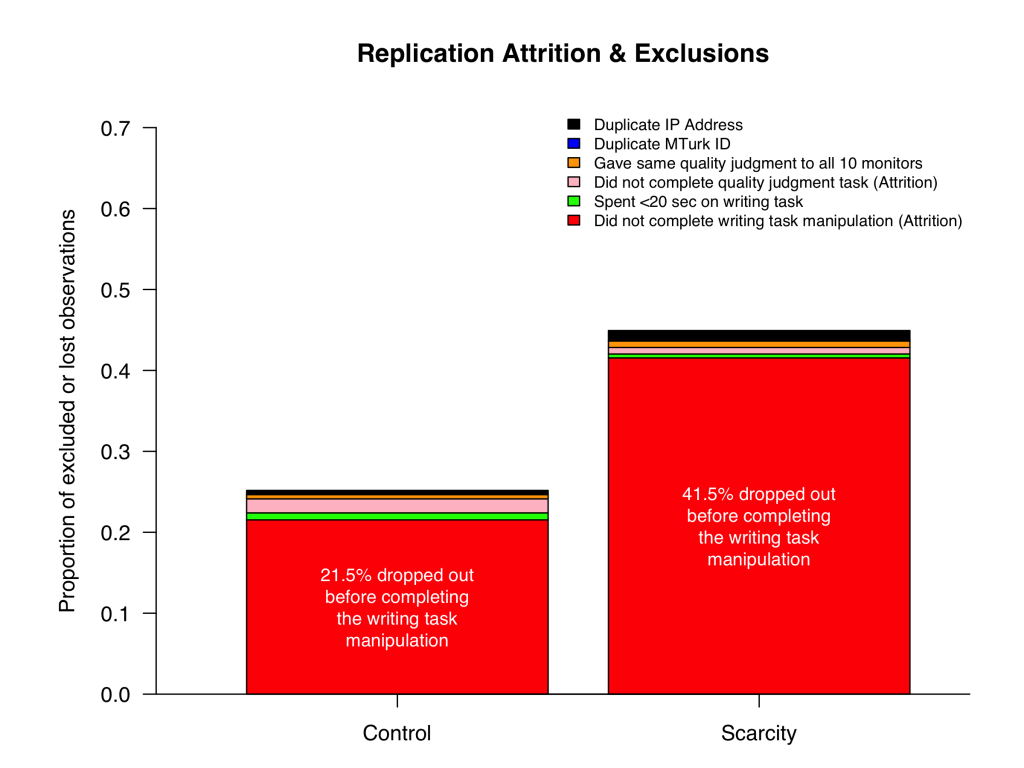
The above graph shows all of the dropouts and pre-registered exclusions in each of the two conditions. You can see that participants who encountered the Scarcity writing task were much more likely to drop out than those who encountered the Control writing task. This differential attrition means that random assignment was compromised, that the people who completed the measures in the Scarcity condition were probably different from those who completed the measures in the Control condition [4].
OK, but how might they be different?
Well, it turns out that good participants – those who follow instructions and honestly answer questions – were more likely to drop out of the Scarcity condition. Surprised? Yeah, us too. But here’s how to make sense of it.
Imagine Lisa is a good, honest participant, while Mr. Burns is a bad, corruptible participant who just wants to get paid. If they are assigned to the Control condition, they are asked to write three things they did last week. This is simple enough for both Lisa to do (honestly) and for Mr. Burns to do (honestly or dishonestly), so both of them do it. But if they are assigned to the Scarcity condition, they are asked to write about three times in which resources were scarce. Maybe this is prohibitively difficult for them to do honestly but easy for them to do dishonestly, in which case Lisa bails but Mr. Burns stays. The result is that the Scarcity condition has (1) fewer people overall and (2) a disproportionate share of Mr. Burnses.
Now, in the context of this study, how can having more bad participants in the Scarcity condition cause the results described above? It will be helpful to answer this question with data. To provide that data, Joe (painstakingly) coded all of the written responses submitted by participants. Participants who sensibly followed the instructions were coded as “Good”; participants who did not were coded as “Bad” [5].
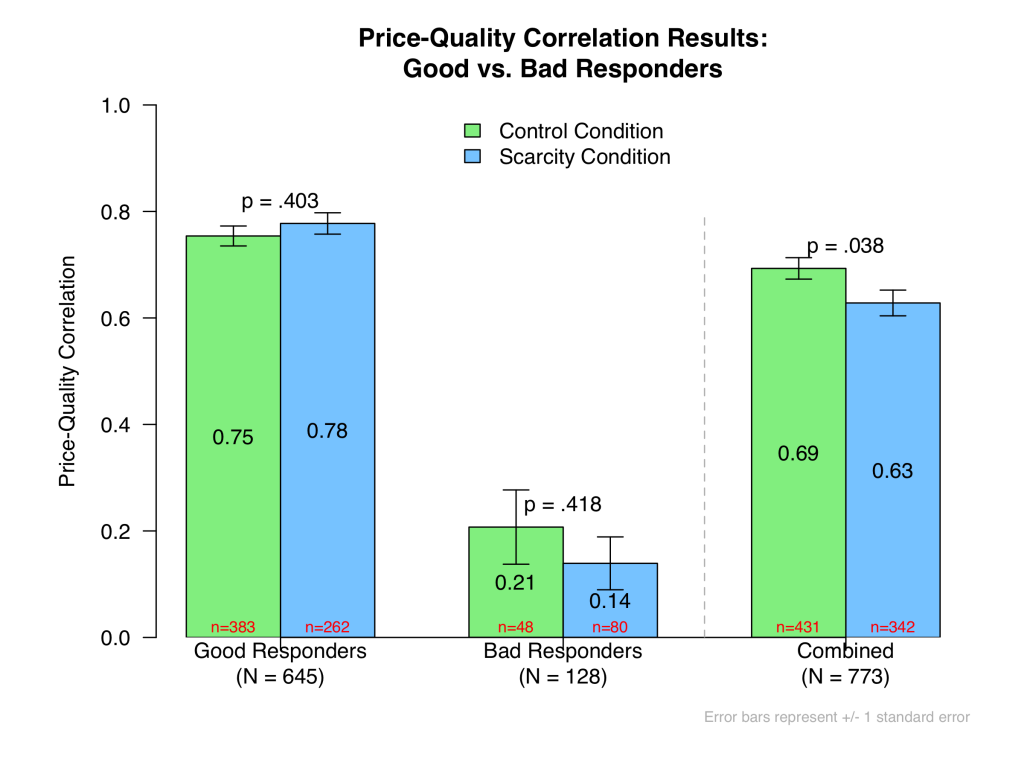
Here are the price-quality correlation results, broken down by Good vs. Bad Responders:
 Whoa.
Whoa.
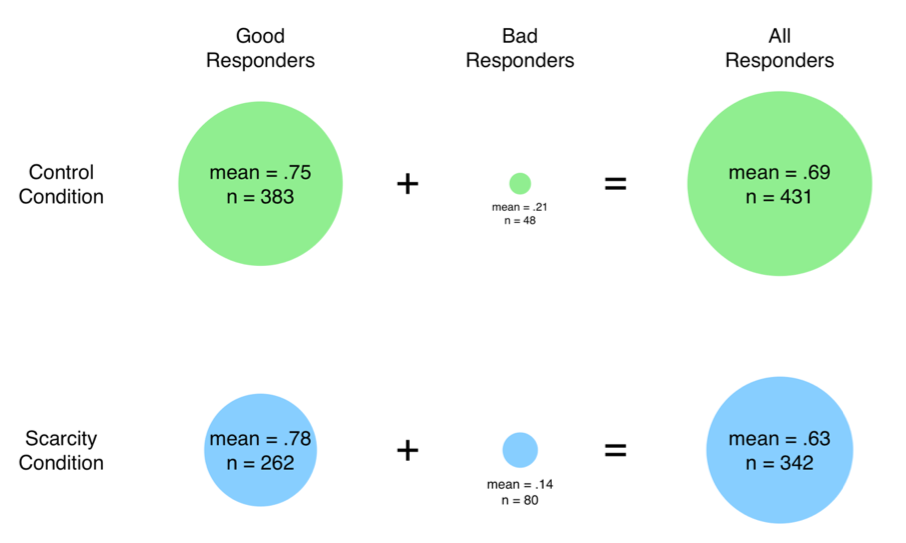
Bad Responders, who comprise 23.4% of the Scarcity condition sample but only 11.1% of the Control condition sample, exhibit much much smaller price-quality correlations than do Good Responders. Why? Recall that in the experimental task, participants were asked to judge the quality of computer monitors based only on their prices. There’s really only one way to do this. Good Responders should say that higher priced monitors should be of higher quality, thereby exhibiting a strong price-quality correlation. Many Bad Responders, on the other hand, may provide senseless quality judgments, causing their price-quality correlations to be much lower.
Now, when you combine the fact that Bad Responders make up a disproportionate share of the Scarcity condition with the fact that Bad Responders are, by virtue of their sometimes meaningless responses, more likely to exhibit small price-quality correlations, you achieve the overall result, whereby those in the Scarcity condition exhibit smaller price-quality correlations. Here’s a picture that illustrates this:
OK, but what about the other measures? Same story.
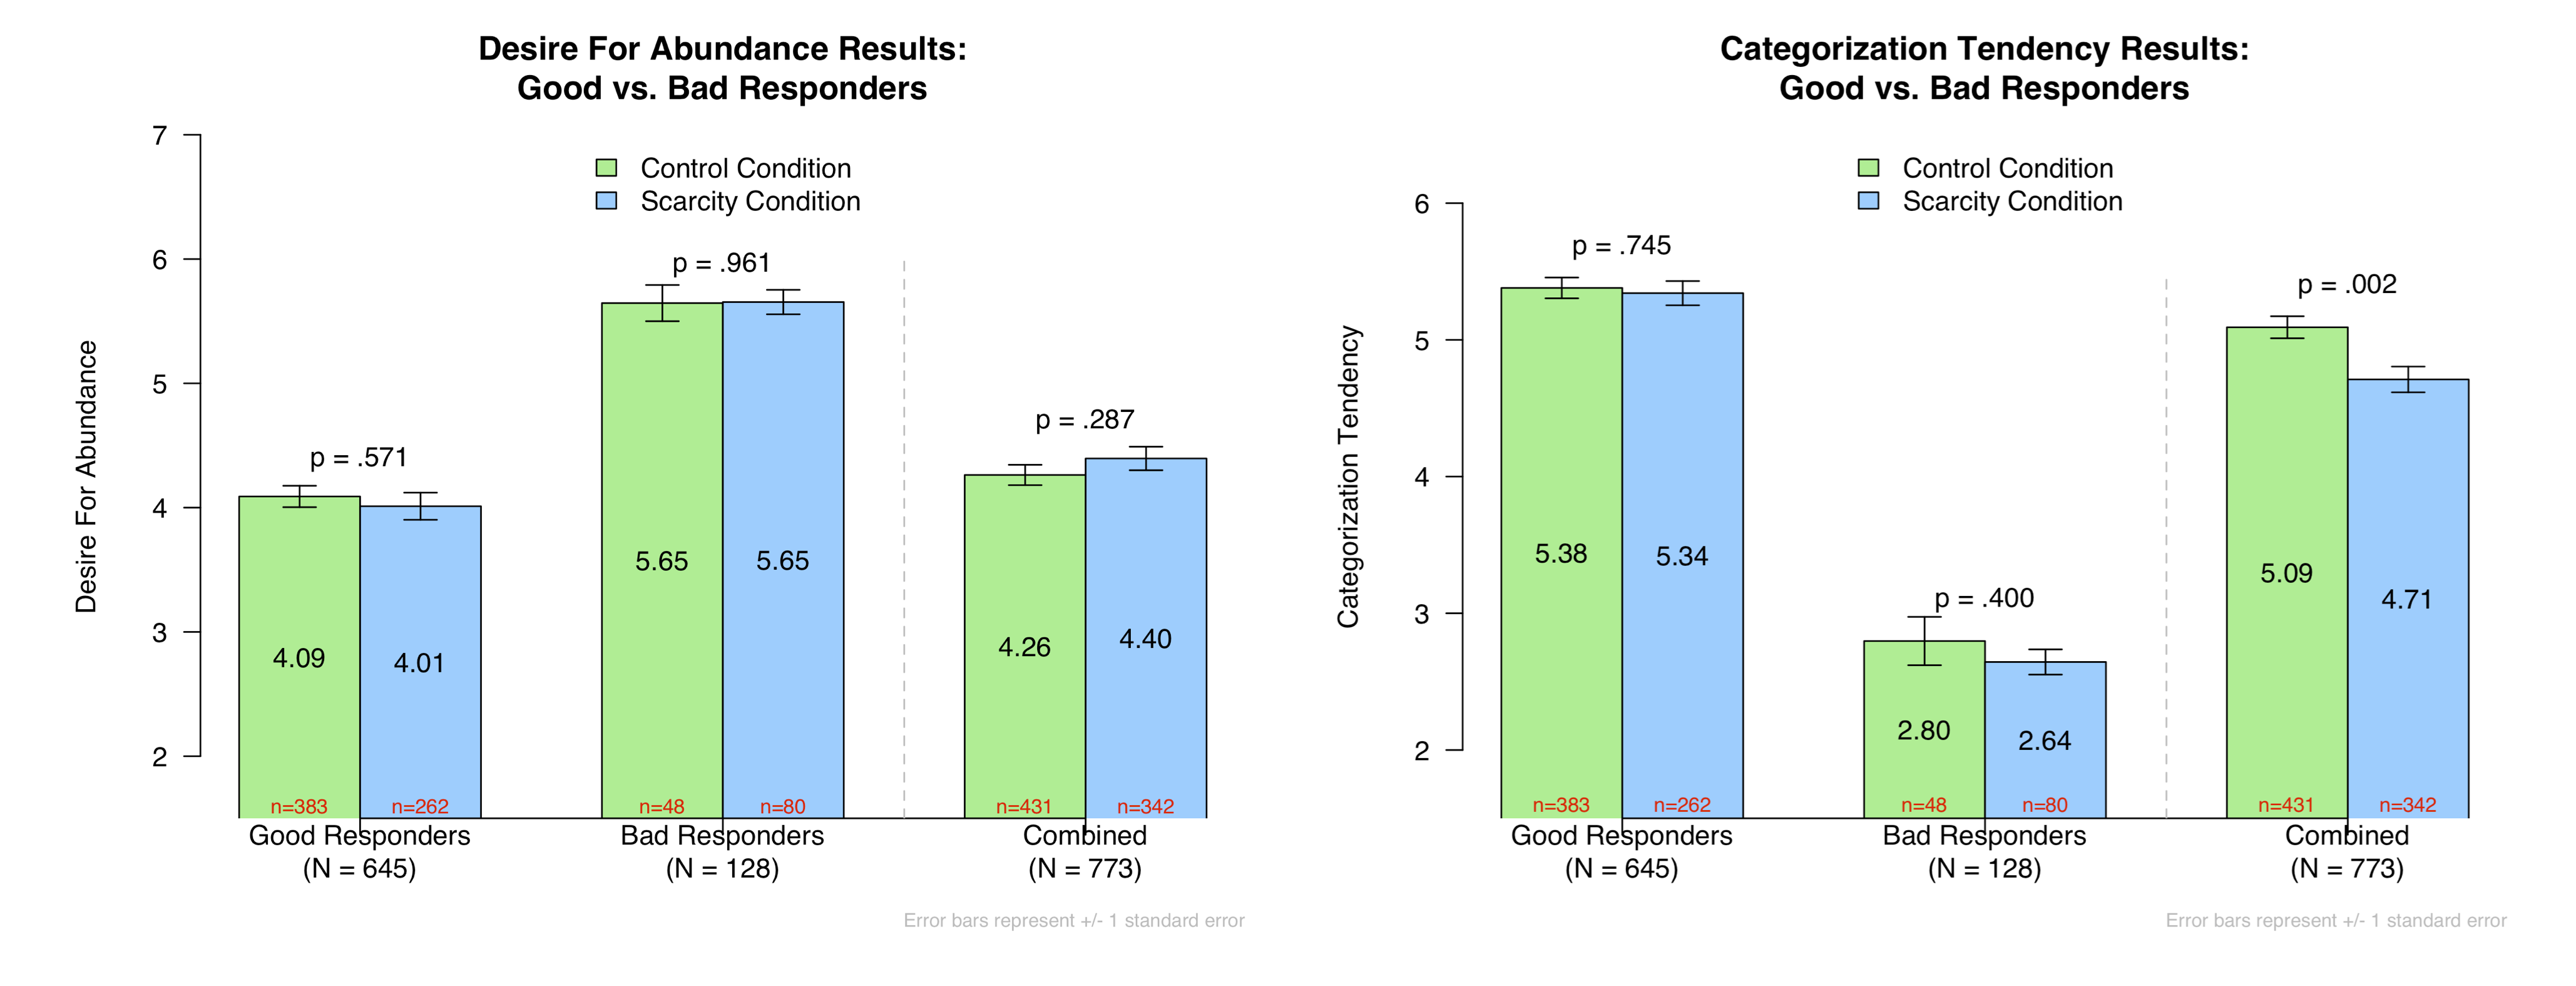
You can see that Bad Responders are much more likely to score highly on Desire For Abundance and low on Categorization Tendency. And in the case of Categorization Tendency, the higher proportion of Bad Responders in the Scarcity condition is enough to produce a highly significant effect overall.
Again, this makes sense. Recall that the Categorization Tendency measure is reverse-coded, and that it is comprised of four items that most humans will not agree with. Thus, most people who fully comprehend these items should score low on Categorization Tendency [6]. The Good Responders don’t agree with them, but the Bad Responders do, probably because they default to answering at the high end of rating scales (a possibility that would also explain the Desire For Abundance results).
So, what have we learned?
As has been recently emphasized (.html), differential attrition is a real thing to worry about, especially in studies in which one task is even slightly more onerous, difficult, or weird than another.
Although differential attrition means that we cannot validly compare Good Responders in the Control condition to Good Responders in the Scarcity condition, it is worth noting that there is no hint of the authors’ hypothesized effects when we look only at Good Responders. In general, true effects should get stronger when selecting for more compliant, higher quality responders. In this study, they got weaker.
Nevertheless, the jury is still out because a true test of this hypothesis would require conducting a study that eliminates the problem of differential attrition.
We actually tried to do this [7]. In a pre-registered study (https://aspredicted.org/md5q8.pdf; N = 2,101), we randomly assigned half of our participants to a condition in which they were (1) warned they would have to do an onerous vowel-counting task as well as the writing task, (2) explicitly asked whether they wanted to continue despite that, and (3) actually did the vowel-counting task. This all happened before they were assigned to the Control vs. Scarcity writing task. Our hope was that Bad Responders would be caught before the writing task, either because they dropped out of the study or because they performed poorly on the vowel counting task (in which case we preregistered to exclude them). A full writeup of this study is here: .pdf.
Alas. On the one hand, we were successful at dramatically reducing attrition. On the other hand, we were unsuccessful at reducing differential attrition, as once again many more participants dropped out of the Scarcity condition than the Control condition.
So then we gave up, and decided to call the whole thing “inconclusive.”
It turns out that eliminating differential attrition is hard. And why shouldn’t it be? Research is hard. Life is hard.

Author feedback
We appreciate the importance of the replication effort and are glad you are doing this work. We thank you for being so cooperative during the preparation process. We are also happy that most of our effects emerged as hypothesized in your replication study.
A close look at your results has led us to identify a couple of important issues. First, what constitutes a “good” and “bad” responder? This is an immensely important (and difficult to answer) question that impacts a tremendous amount of behavioral research. The criteria you applied to the replication study showed a disproportionate number of bad responders in the scarcity (vs. control) condition, thus creating a confound between “participant goodness” and resource scarcity as potential drivers of our documented effects. To further address this issue, we went back to our original data and re-examined participant responses across conditions. First, we looked at criteria you used as indicators of bad responders to see if they varied as a function of scarcity vs. control condition. However, in our data, the percentage of participants giving poor quality responses in the writing task did not differ across conditions (p=.50). Also, the average time spent completing the writing task (p=.87) and the variance of the time spent on the writing task (p=.63) did not differ by condition. Another indicator of bad responders, the percentage of participants giving the same quality rating to all 10 computer monitors also did not differ across conditions (p=.29, although we should note that these numbers were very small). Further, if there are disproportionately more “bad” responders in the scarcity (vs. control) condition, it seems reasonable to expect greater variance in participant responses in the scarcity (vs. control) condition due to bad responders giving answers that are not contingent on experimental stimuli (i.e., more random and noisy). However, neither the variance of price-quality correlations (p>.99), desire for abundance (p=.52), nor categorization tendency (p=.12) differed in the scarcity (vs. control) condition.
Participants’ motivations for quitting when confronted with the scarcity writing task is also worth further discussion. One possibility, as you suggest, is that the scarcity writing task “is prohibitively difficult for [participants] to do honestly but easy for them to do dishonestly,” and thus that “bad” (vs. “good”) responders are more likely to stay (vs. drop out) in the scarcity condition. It is also possible, however, that bad responders might also have more difficulty within the narrower response domain in the scarcity condition (e.g., generating a fake scarcity experience that they never had). Also, given that scarcity is a pervasive aspect of human life (Booth 1984; Lynn 1991), genuine scarcity-related experiences might be easily accessible to good responders. In any case, we appreciate you bringing up this valuable point.
Reading this web article has given us an increased appreciation of the importance of the differential attrition phenomenon and the impact it can have on experimental findings. We applaud the Data Replicada team’s efforts to illustrate that phenomenon and we will definitely be more aware of this issue in the future. We encourage other researchers to carefully consider this as well."
Footnotes.
- The authors also reported successful mediation, but we pre-registered not to conduct these mediational analyses. [↩]
- First, on one page of the original survey the authors showed participants a table that displayed 12 computer monitors, alongside a number of attributes, including brand name, country of origin, model year, screen size, price, and quality rating. The original study was conducted in 2017, so we felt we should update this table so as to show participants contemporary products and prices. Importantly, however, we did preserve the observed price-quality correlation depicted in the original table, as it was .6977 in the original study and .6980 in ours (this .pdf shows the two tables side-by-side). (A special thanks to our excellent research assistant Louise Lu, for helping us update these stimuli.) Second, whereas the original authors paid MTurkers no more than 20 cents to complete the survey, we were compelled to pay 50 cents, given how long it took to complete the survey. Third, the authors weren’t certain about the exact criteria they used to recruit participants, so we had to use our best judgment. Finally, during the quality judgment task, the original authors presented the 10 to-be-judged computer monitors (and their prices) in a fixed order, but they had no record of what that order was. We decided to create four different orders and to randomly assign participants to see one of those orders. [↩]
- In this study, we also randomly assigned one-fifth of our participants to complete a manipulation check that assessed their perceptions of resource scarcity instead of these three measures. Those participants (n = 120 in the Control condition and n = 76 in the Scarcity condition after pre-registered exclusions) are not included in the sample sizes reported in this post, and are necessarily excluded from all other analyses (since they did not complete any additional measures). We did find that the scarcity manipulation increased self-reported scarcity perceptions, t(194) = 2.22, p = .027. However this effect was quite a bit smaller than what the authors reported in their Web Appendix P: d = .33 in our replication vs. d = .69 in the original study. [↩]
- In the original study, there were 78 participants in the Control condition and 71 in the Scarcity condition. This discrepancy in per-condition sample sizes suggests that the original authors may have encountered differential attrition as well, though it may have been a smaller problem than what we’ve encountered here. [↩]
- A few notes about the coding. First, Joe was necessarily not blind to condition (or hypothesis) while doing the coding, but he was blind to participants responses’ to the dependent measures. Also, the vast majority of these judgments were completely unambiguous, like when respondents just wrote “good” when describing a scarce event in detail. Joe’s resulting “BadResponse” variable is in the posted dataset if you want to take a look. [↩]
- We changed these sentences on July 22, 2020, one day after publication. They used to read "…items that, really, no human being should agree with. Thus, no one who fully comprehends these items should score low on Categorization Tendency." We received an email from a human being who did agree with two of the items, and so our characterization was clearly mistaken. We appreciate that feedback, and apologize for the earlier mischaracterization. [↩]
- We actually ran two more studies. The first of these additional studies only investigated responses to the categorization tendency dependent variable. We randomly assigned participants (N = 1,556) to complete this measure either before or after being assigned to the Control vs. Scarcity condition. We were wondering whether the pattern of differential attrition would be so pronounced as to cause condition differences on the categorization tendency variable even before participants were assigned to condition. Instead, although we observed differential attrition in this study, we observed no effect of condition on categorization tendency, regardless of whether that measure was completed before or after the condition assignment. In other words, we did not replicate the significant effect observed here. For a full writeup of this study, click here: .pdf. [↩]
