A recently published Nature paper (.htm) examined an interesting psychological hypothesis and applied it to a policy relevant question. The authors ran an ambitious field experiment and posted all their data, code, and materials. They also were transparent in showing the results of many different analyses, including some that yielded non-significant results. This is in many ways an exemplary effort [1].
In this post, however, we focus on what we perceive to be two important weaknesses of this research effort: (1) the analyses deviated from the authors' pre-registration in some potentially important ways, and (2) the key manipulation contains confounds that are fully evident only in the original materials. This example illustrates an important point that is often missed: scientific transparency does not attest to the validity of the claims made in a paper; rather, it attests to the evaluability of those claims. This is a point that Simine Vazire has made: “Transparency doesn’t guarantee credibility; transparency and scrutiny together guarantee that research gets the credibility it deserves" (.htm).
At the end of the day, we are skeptical of the key claims and inferences made in the Nature article. But our stance of evidence-based skepticism is made possible because the authors engaged in such transparent research practices. Without transparency, we would be forced to either blindly accept or blindly doubt the results. As we have said before (.pdf), transparency does not tie researchers’ hands. It opens readers' eyes.
All files needed to reproduce the results presented in this post are available at Researchbox.org/656.
The Field Experiment
The field experiment involved randomly assigning 55 public housing building complexes to treatment vs. control [2]. In the treatment condition, a police officer reached out to the residents, both by mail and in person, to share personal information about themselves (e.g., “I enjoy fishing” and “My parents were born in Sicily”). The control condition buildings had no intervention whatsoever. The paper reports many analyses, but the key result, and the one emphasized in the paper, is that the treatment reduced crime by 6.9% during the first three months (p = .036). This is the only significant effect (p < .05) of treatment vs. control mentioned in the main text of the article. We will refer to it as the relatable cop effect.
Pre-registrations Are Useful (Even When They Are Not Followed)
Over the years, we have learned that p-values close to .05 may be less diagnostic of true effects than they are of selective reporting/p-hacking. Thus, there is reason to be skeptical of a finding when the key statistical result is p = .036. However, a p = .036 can be taken at face value if it comes from a pre-registered study and if that pre-registration has been followed.
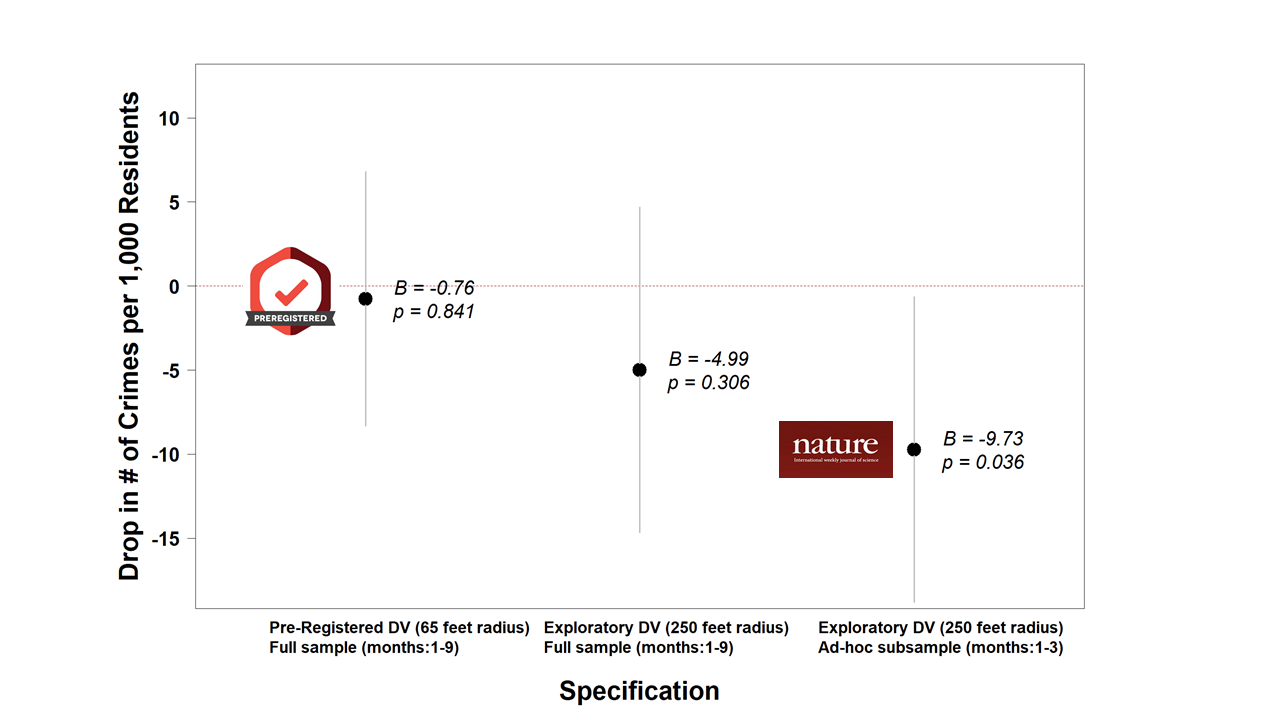
This field experiment was pre-registered [3]. But the published analyses did deviate from that pre-registration. First, the planned primary analysis defined the dependent variables as (1) crimes occurring within 65 feet of the buildings and (2) the share of those crimes resulting in arrests [4], [5]. But that p = .036 result is for crimes that occurred within 250 feet, which is an analysis mentioned in the pre-registration's “exploratory analyses” section, alongside several additional dependent variables and analyses (more on this below). Second, that p = .036 comes from an analysis that focused on crimes committed within the first three months of the intervention. But the authors have data for nine months and their pre-registration did not specify that the analysis would be restricted to the first three months, or that they would run any analyses using any subset of the data [6]. When using the pre-registered full sample and dependent variable, the result is p = .841:
Fig. 1. Point estimates and p-values from pre-registered vs. exploratory analyses in the Nature paper.
At this point, we need to make four things clear:
1) All p-values mentioned above are reported in the paper and/or its supplement. The authors did not hide those results.
2) There is nothing wrong with focusing on crimes occurring within 250 feet or within three months of the intervention. These are justifiable decisions.
3) What is wrong – not ethically, but mathematically – is choosing which analyses to report or emphasize based on the results that were obtained, and then taking the resulting p-values at face value. This footnote contains a simple explanation: [7].
4) The pre-registration had a section for “exploratory analyses.” That section did mention using the 250-foot crime radius as a robustness check. But it also mentioned running several additional analyses that are not in the paper, such as the effect of the intervention on 311 calls, on "broken property" rates, and on misdemeanors vs. felonies. (Page 22 of the supplement shows that none of them were impacted by the intervention). The exploratory section also includes a proposal to run a negative binomial instead of a linear regression, and to collapse data within “development groups”. Note that although the authors specified a wide variety of exploratory analyses to attempt, they never mentioned planning to attempt any analyses on a subset of the data based on time since the intervention. To appreciate the flexibility available to the authors of the paper, consider that they could have reported a successful intervention if any of the many combinations of pre-registered and exploratory analyses showed a significant reduction in crime or proxies for crime. For example, one could declare the treatment to be successful if crimes committed within 65 feet were reduced for the first 4 months, or if 311 calls were reduced during the first 6 months, or if broken property rates declined within the first 2 months, etc.
When Robustness Is Illusory
Much to the authors’ credit, they did not only report that p = .036 result. As mentioned above, they did report analyses showing that the effect is not significant for other time periods (e.g., 4-6 months and 7-9 months) and crime radii. Moreover, they report a p-value “heat map”, showing how the results vary across 9 time periods x 9 crime radii, for a total of 81 different analyses. Here is the figure they report. Note that the blue box around p = .036 is in the original. We have altered the figure only by adding axis labels on the top and to the left:
Fig. 2. P-value heatmap (Figure ED4 in the Nature paper).
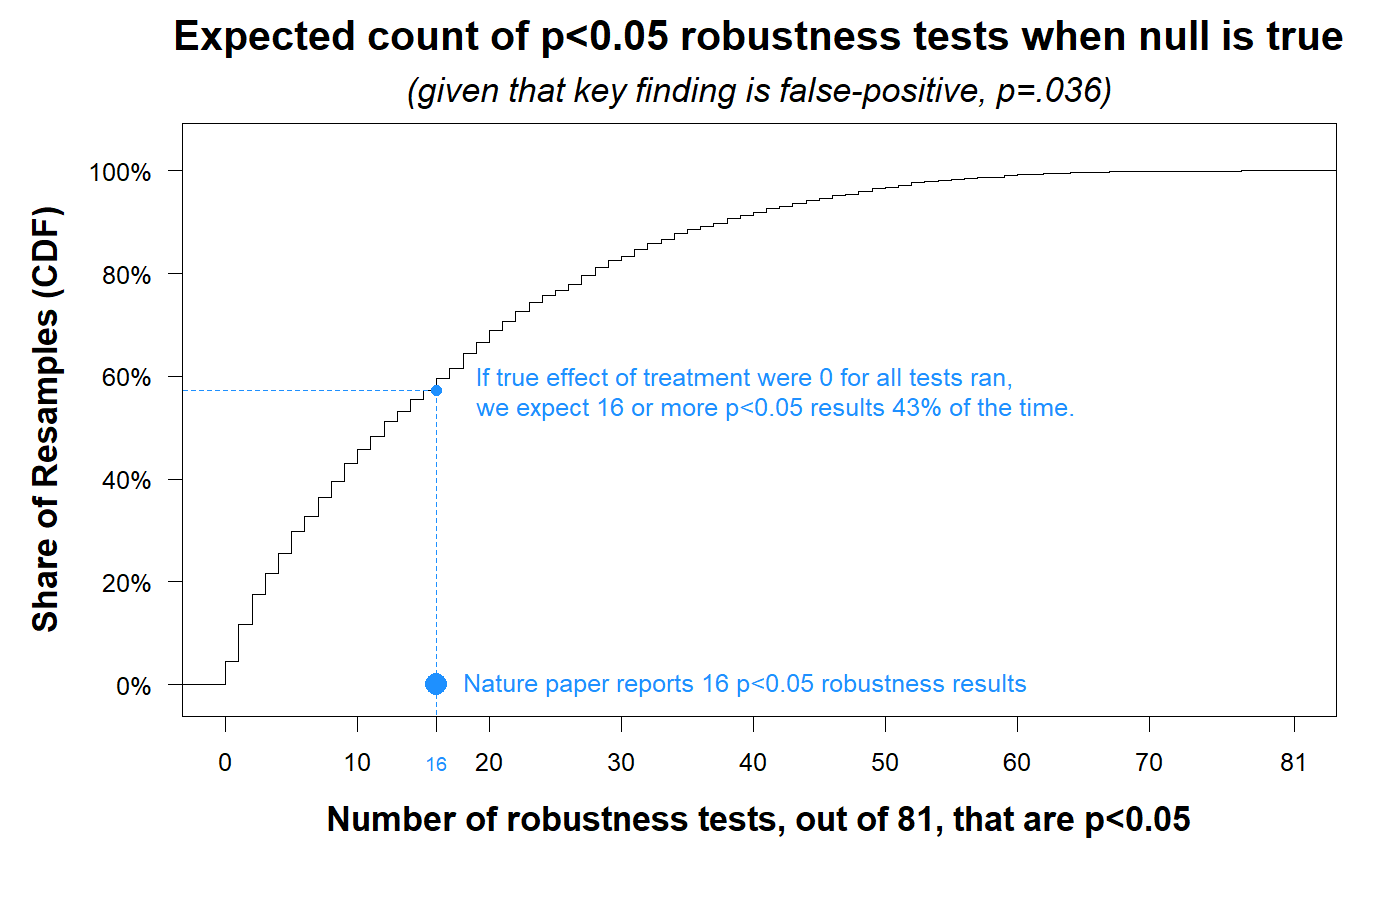
This heat map seems reassuring; 16 of the 81 analyses are p < .05, and 27 are p < .10. But it is not as reassuring as it seems. The problem is that many of these tests are highly correlated with each other, because they are conducted on datasets that have a great deal of overlap. For example, the crime data at 3 months and within 250 feet (p = .036) is very similar to the crime data at 4 months and within 250 feet (p = .028). This means that even if the key finding (p = .036) were a false-positive, a finding caused by chance alone, many of these very similar robustness tests may also be significant due to chance alone. What seems like robustness may be a mirage. (Uri wrote about this a while back in a post called “P-hacked Hypotheses Are Deceivingly Robust": https://datacolada.org/48).
To assess whether this is a problem in this particular case, we need to try to answer the following question: If that p = .036 result were a false-positive, how many of the 81 tests in the heat map would we expect to be significant (p < .05)?
Because the authors posted their data and code, we were able to answer this question.
The short answer is that if p = .036 were a false-positive result, you’d expect to observe a heat map that is at least as reassuring as the one above about 43% of the time.
The robustness is illusory.
Computing that 43% involved some (we think) cool resampling simulations that are hiding behind this green button.
Posted Materials Are Useful (Especially When They Reveal Confounds)
If you are unpersuaded by the arguments above, well, first, thanks for continuing to read this far, but, second, OK, let’s take that p = .036 at face value, and assume that the treatment really did lead to a significant drop in crime. Let’s explore why crime could have dropped, if it had dropped.
To answer that question, we will now turn to another useful element of open research: posting original study materials.
The authors’ hypothesis is that if you learn something about someone else (e.g., that their parents were born in Sicily), then you will think that they know more about you. Thus, in the treatment condition, residents received:
"an outreach card and letter about the NCO, describing mundane information about the officer, such as their favourite food, their hobbies or why they became an officer” (p. 299).
From this description in the paper, readers may get the sense that the key manipulation was whether residents received mundane information about their local police officer.
But an examination of the original materials reveals a much more heavy-handed and arguably confounded manipulation. Specifically, residents in the treatment buildings didn't just differ from residents in the control buildings in their knowledge of police officers’ hobbies and ancestral lands. They also differed in that they received physical pieces of paper that contained the name and phone number of the police officer they could contact, delivered both by mail and then again in person by that officer. Moreover, residents received a letter from the officers which read:
Figure 4. Letter that treatment-condition residents received in the field experiment.
(bold and blacked out text in the original; red boxes added for this post)
Again, residents of buildings in the control condition had no intervention whatsoever.
So if the field experiment had worked, it could be for a number of reasons. It could be because of the mundane information that residents received about the officers, it could be because they were encouraged to call the police to report suspicious activity, it could be because the officers provided their contact information, and/or it could be because would-be criminals thought that officers who bothered to reach out to the residents in this way would also be more attentively patrolling the neighborhood.
In other words, the relatable cop effect could instead be an available or attentive cop effect [10].
![]()
Author feedback
Our policy (.htm) is to share drafts of blog posts with authors whose work we discuss, in order to solicit suggestions for things we should change prior to posting, and to invite them to write a response that we link to at the end of the post. We contacted the authors of the Nature paper to share an earlier draft. They provided prompt, cordial, and constructive feedback. After revising the post based on their feedback we shared it with them again, and invited them to address any remaining issues in a response. After reading their response we realized that calling the confounds “unreported” is technically incorrect since the original materials are in the paper itself. We removed that language. We do, however, think the magnitude and nature of the confounds are revealed only in the original materials, which, again, the authors helpfully posted. You can read their response here: (.pdf).
Footnotes.
- The paper also includes nine MTurk experiments, which we do not discuss here [↩]
- There were 69 buildings, but the authors randomized at the building group level; there were 55 groups of buildings, with most "groups" consisting of one building. [↩]
- The pre-registration is not a formal pre-registration hosted by a site like AsPredicted or the SocialScienceRegistry; rather, it is a .pdf file uploaded to the OSF (.htm). It was uploaded on November 30, 2018, about 10 months after the intervention took place (in January 2018), but before the authors received the crime data that is the subject of this post. [↩]
- The pre-registration reads: "We plan to evaluate the effects of the intervention on each of our two primary outcomes (all crimes committed within 65 feet of each NYCHA campus and share of crimes resulting in arrest)," p. 3, underlining added. [↩]
- Because most of the analyses in the paper focus on the dependent variable that obtained p = .036, “crimes” rather than “arrests”, we do the same in this post. The authors do report the effects of the treatment on the “arrests” variable as marginally significant: p = .07 or p = .08, depending on the analysis. [↩]
- The pre-registration indicates a plan to use data “from five years before the intervention until nine months after this intervention” (p. 2) and refers (on p. 3) to the possibility that there may be “modest numbers of crimes over the nine month study period.” There is no mention anywhere of using 3 months of data for any analysis. [↩]
- The invalidity of p-values resulting from analyses selected post-hoc arises from a simple mathematical fact: the probability of A is smaller than the probability of (A or B or C). In this particular context, if the intervention had no real effect on crime, the probability that a significant (p < .05) result is obtained for one pre-specified analysis – e.g., using the planned crime radius of 65 feet and all nine months of data – is 5%. The probability of a false-positive is necessarily higher than 5% if researchers run additional analyses with different dependent variables and/or on multiple subsets of the data. See our "False-Positive Psychology" paper (.pdf) for more details. Finally, it is worth noting that multiple analyses are similarly problematic if you use Bayesian statistics instead, as the probability that (A or B or C) has a Bayes Factor >3 is greater than the probability that A has a Bayes Factor >3. Running multiple analyses on the same data also invalidates confidence intervals. [↩]
- To be conservative, we chose values that were between .036 and .070; choosing p-values lower than .036 would produce heat maps with even more significant p-values. [↩]
- We can do the same analysis using p < .10 as the cutoff for each of the robustness tests. Once again, under the null of no effects whatsoever, we find that we observe what the authors observed – at least 27 results that are p < .10 – 46% of the time (see CDF .png). [↩]
- To the authors’ credit, they did use survey results to try to narrow down the possible mechanisms. This survey, which was not pre-registered and probably not representative of the population of residents (since most surveys aren’t), was conducted two months after the intervention. Contrary to the main thesis of this article, they did not find that the treatment influenced residents’ beliefs that officers knew more about them (p = .86). Indeed, there were no condition differences on 18 of the 20 questions asked in the survey. They did find that treatment condition residents were more likely to believe that officers would find out about illegal activity, though this effect was not highly significant (p = .02), especially in light of the fact that it was 1 of 20 measures that were analyzed. Even if this effect is real, we cannot know whether it emerged because officers shared personal information with the residents, or because of one of the aforementioned confounds. [↩]


