In this post, we report our attempt to replicate a study in a recently published Journal of Marketing Research (JMR) article entitled, “Having Control Over and Above Situations: The Influence of Elevated Viewpoints on Risk Taking” (.htm). The article’s abstract summarizes the key result: “consumers’ views of scenery from a high physical elevation induce an illusory source of control, which in turn intensifies risk taking.”
Four of the article’s seven studies were conducted on MTurk. We tried to replicate Study 1b because it has the smallest reported p-value of the four (p = .016). This study (N = 203) found that “people exposed to high-elevation sceneries [were] more willing to purchase new products than people exposed to low-elevation images” (p. 56). This effect is hypothesized to emerge because exposure to high elevation sceneries increases risk-taking, and purchasing new products is a risky endeavor [1].
We contacted the author of the paper to request the materials needed to conduct a replication. He was extremely forthcoming and polite, replying in a matter of hours, while quickly and thoroughly answering all of our subsequent questions. We are grateful to him for his help and professionalism.
The Replication
In the preregistered replication (https://aspredicted.org/9zw6i.pdf), we used the same instructions, procedures, images, questions, and participant population as in the original study. Except for sample size – we sought to get three times the original sample size – the only difference we are aware of between our study and the original is that our formatting of the scenery questions on Qualtrics was slightly different from the original author’s formatting (see this .pdf for an example). You can access our Qualtrics survey here (.qsf), our materials here (.pdf), our data here (.csv), our codebook here (.xlsx), and our R code here (.R).
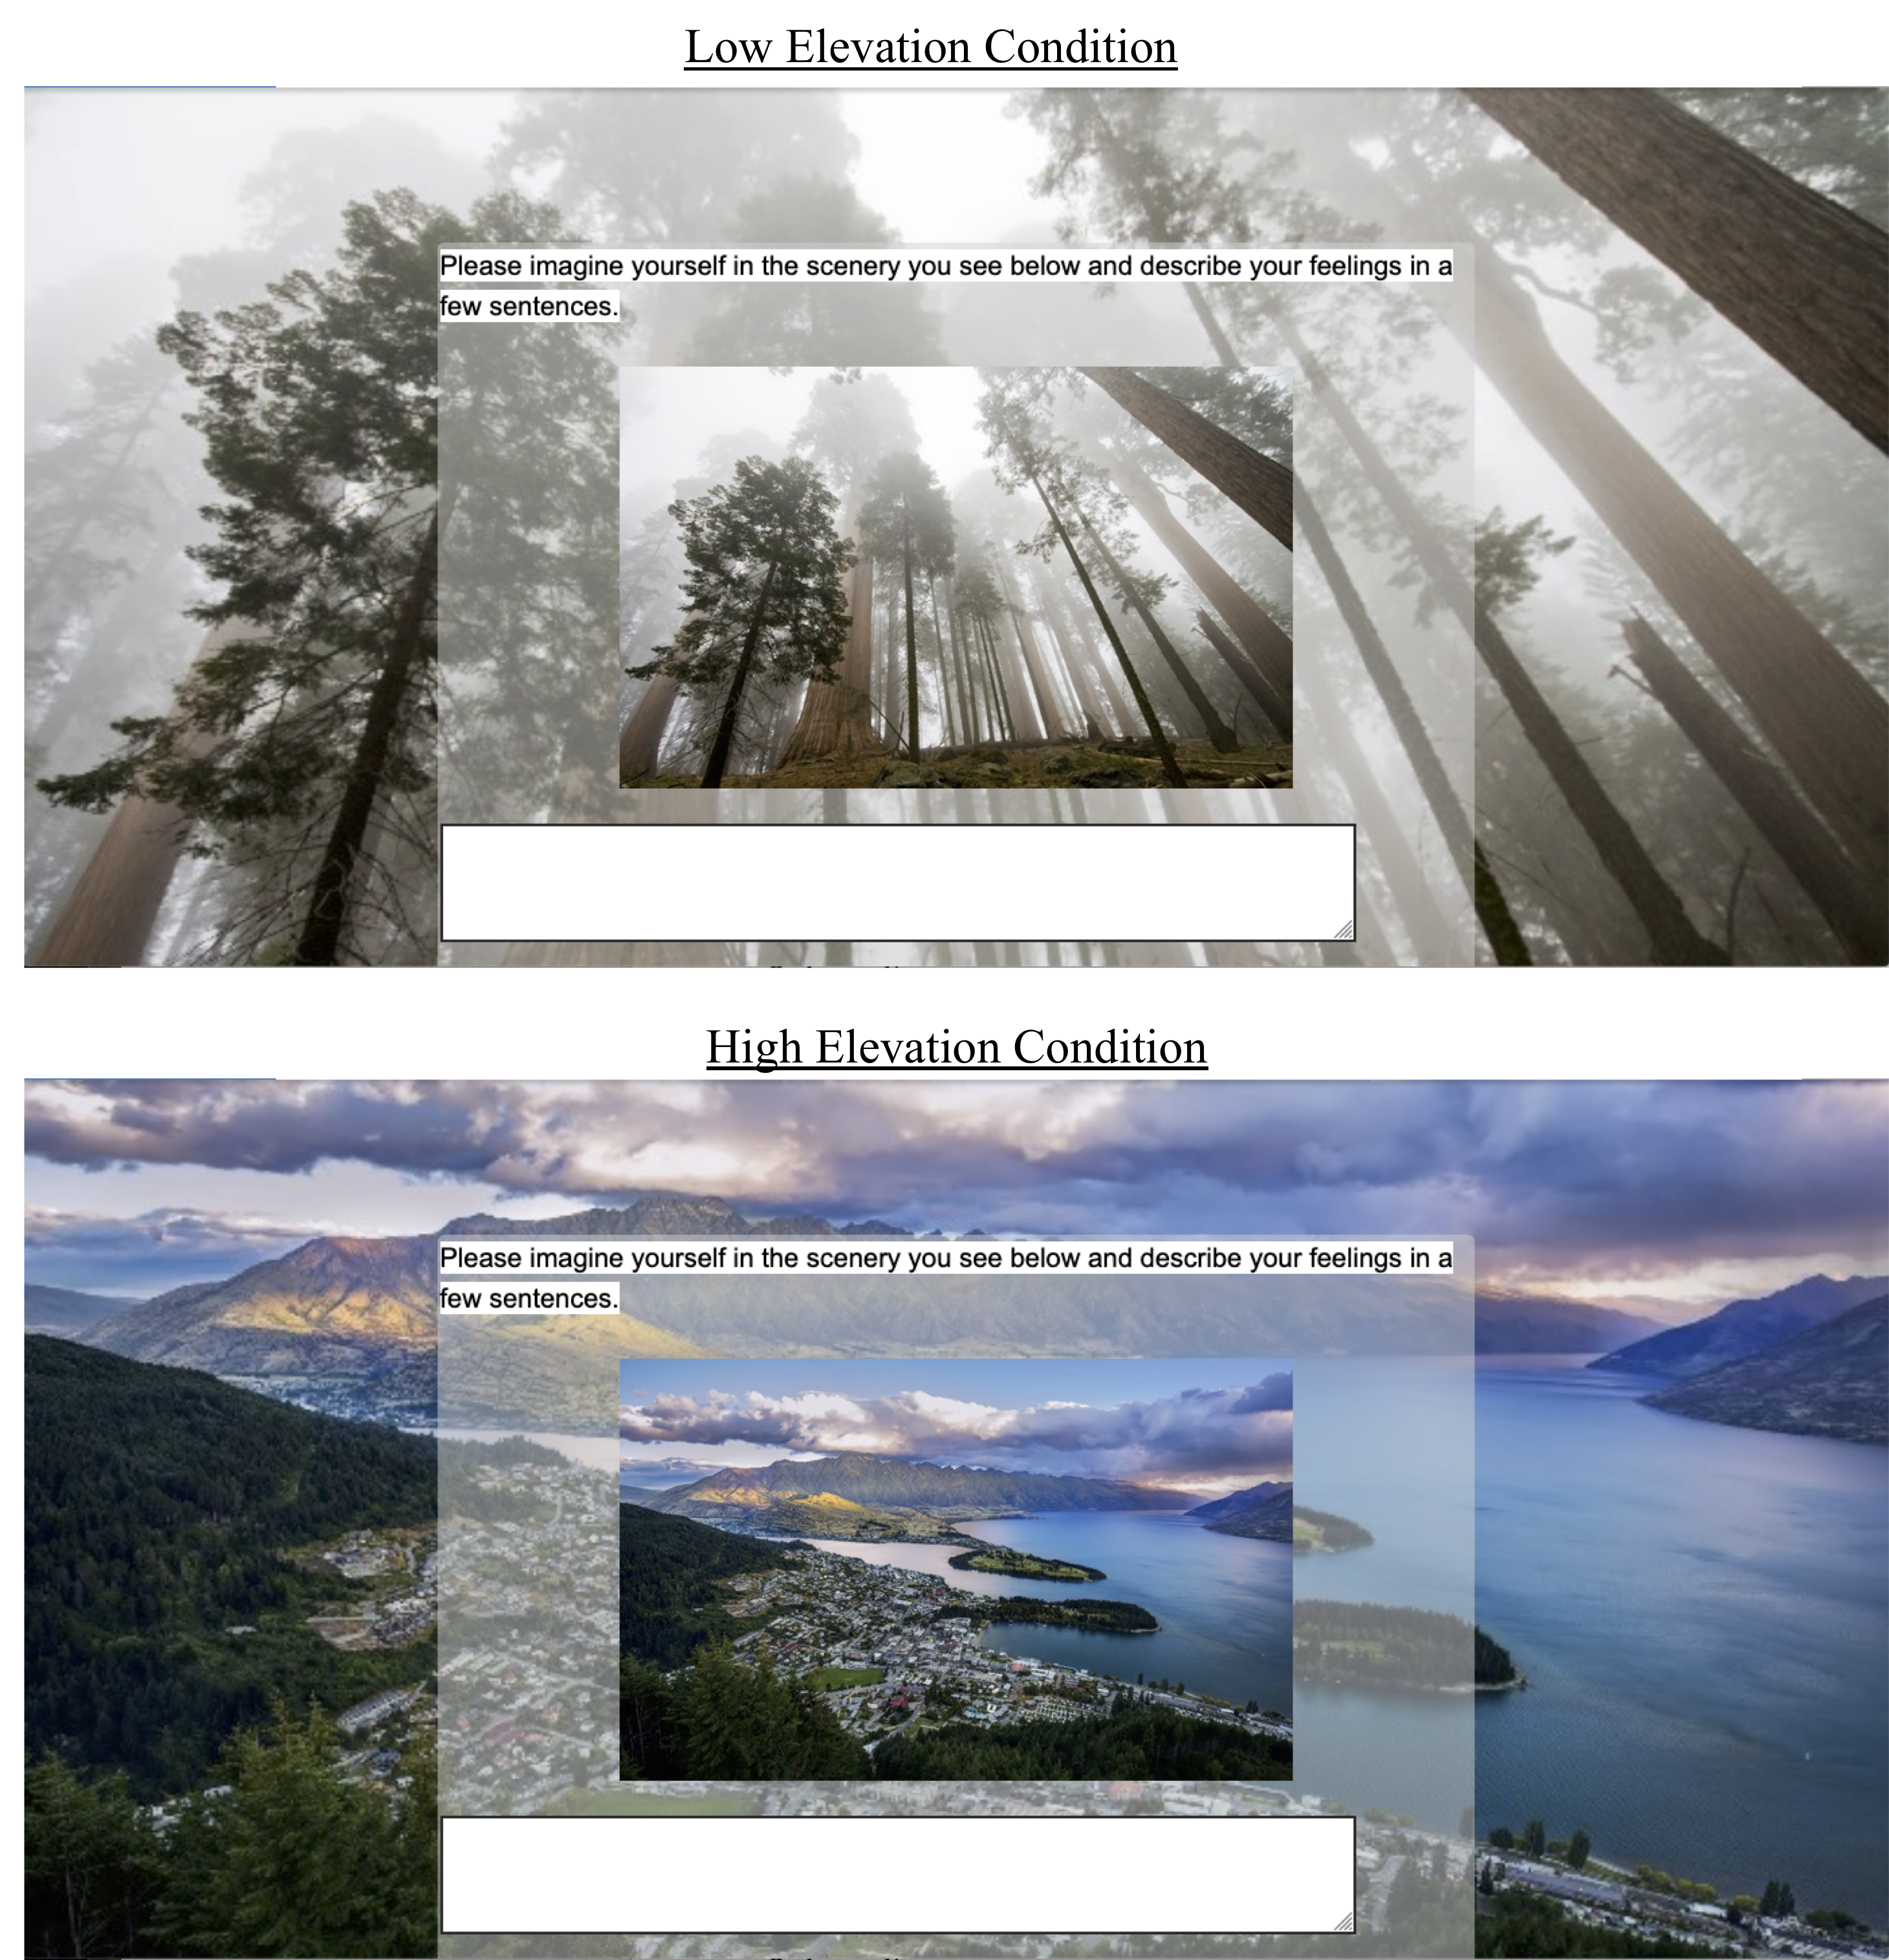
We asked 603 MTurkers to complete an online survey that featured two ostensibly separate studies. First, participants saw five images, taken from a low vertical position vs. high vertical position, and described their feelings about each.
Here’s an example:
In the ostensibly unrelated second study, participants rated their likelihood of purchasing each of four new products. Here is an image of one of the products:
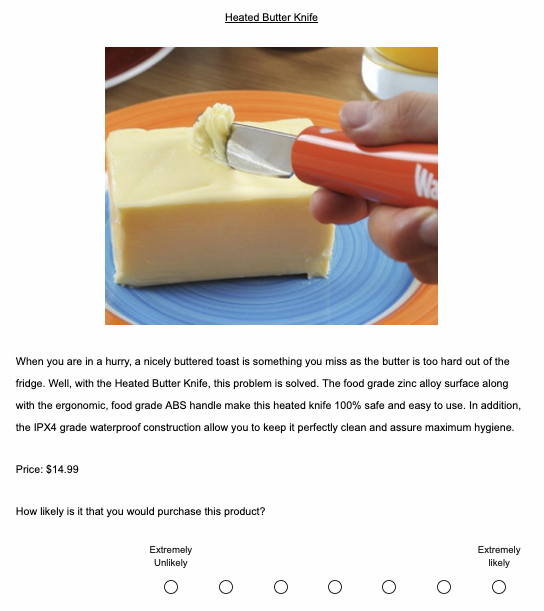
So the original study found that those exposed to the forest image (and other low-elevation images) were less likely to say that they would purchase the heated butter knife (and other new products) than those exposed to the hilltop image (and other high-elevation images).
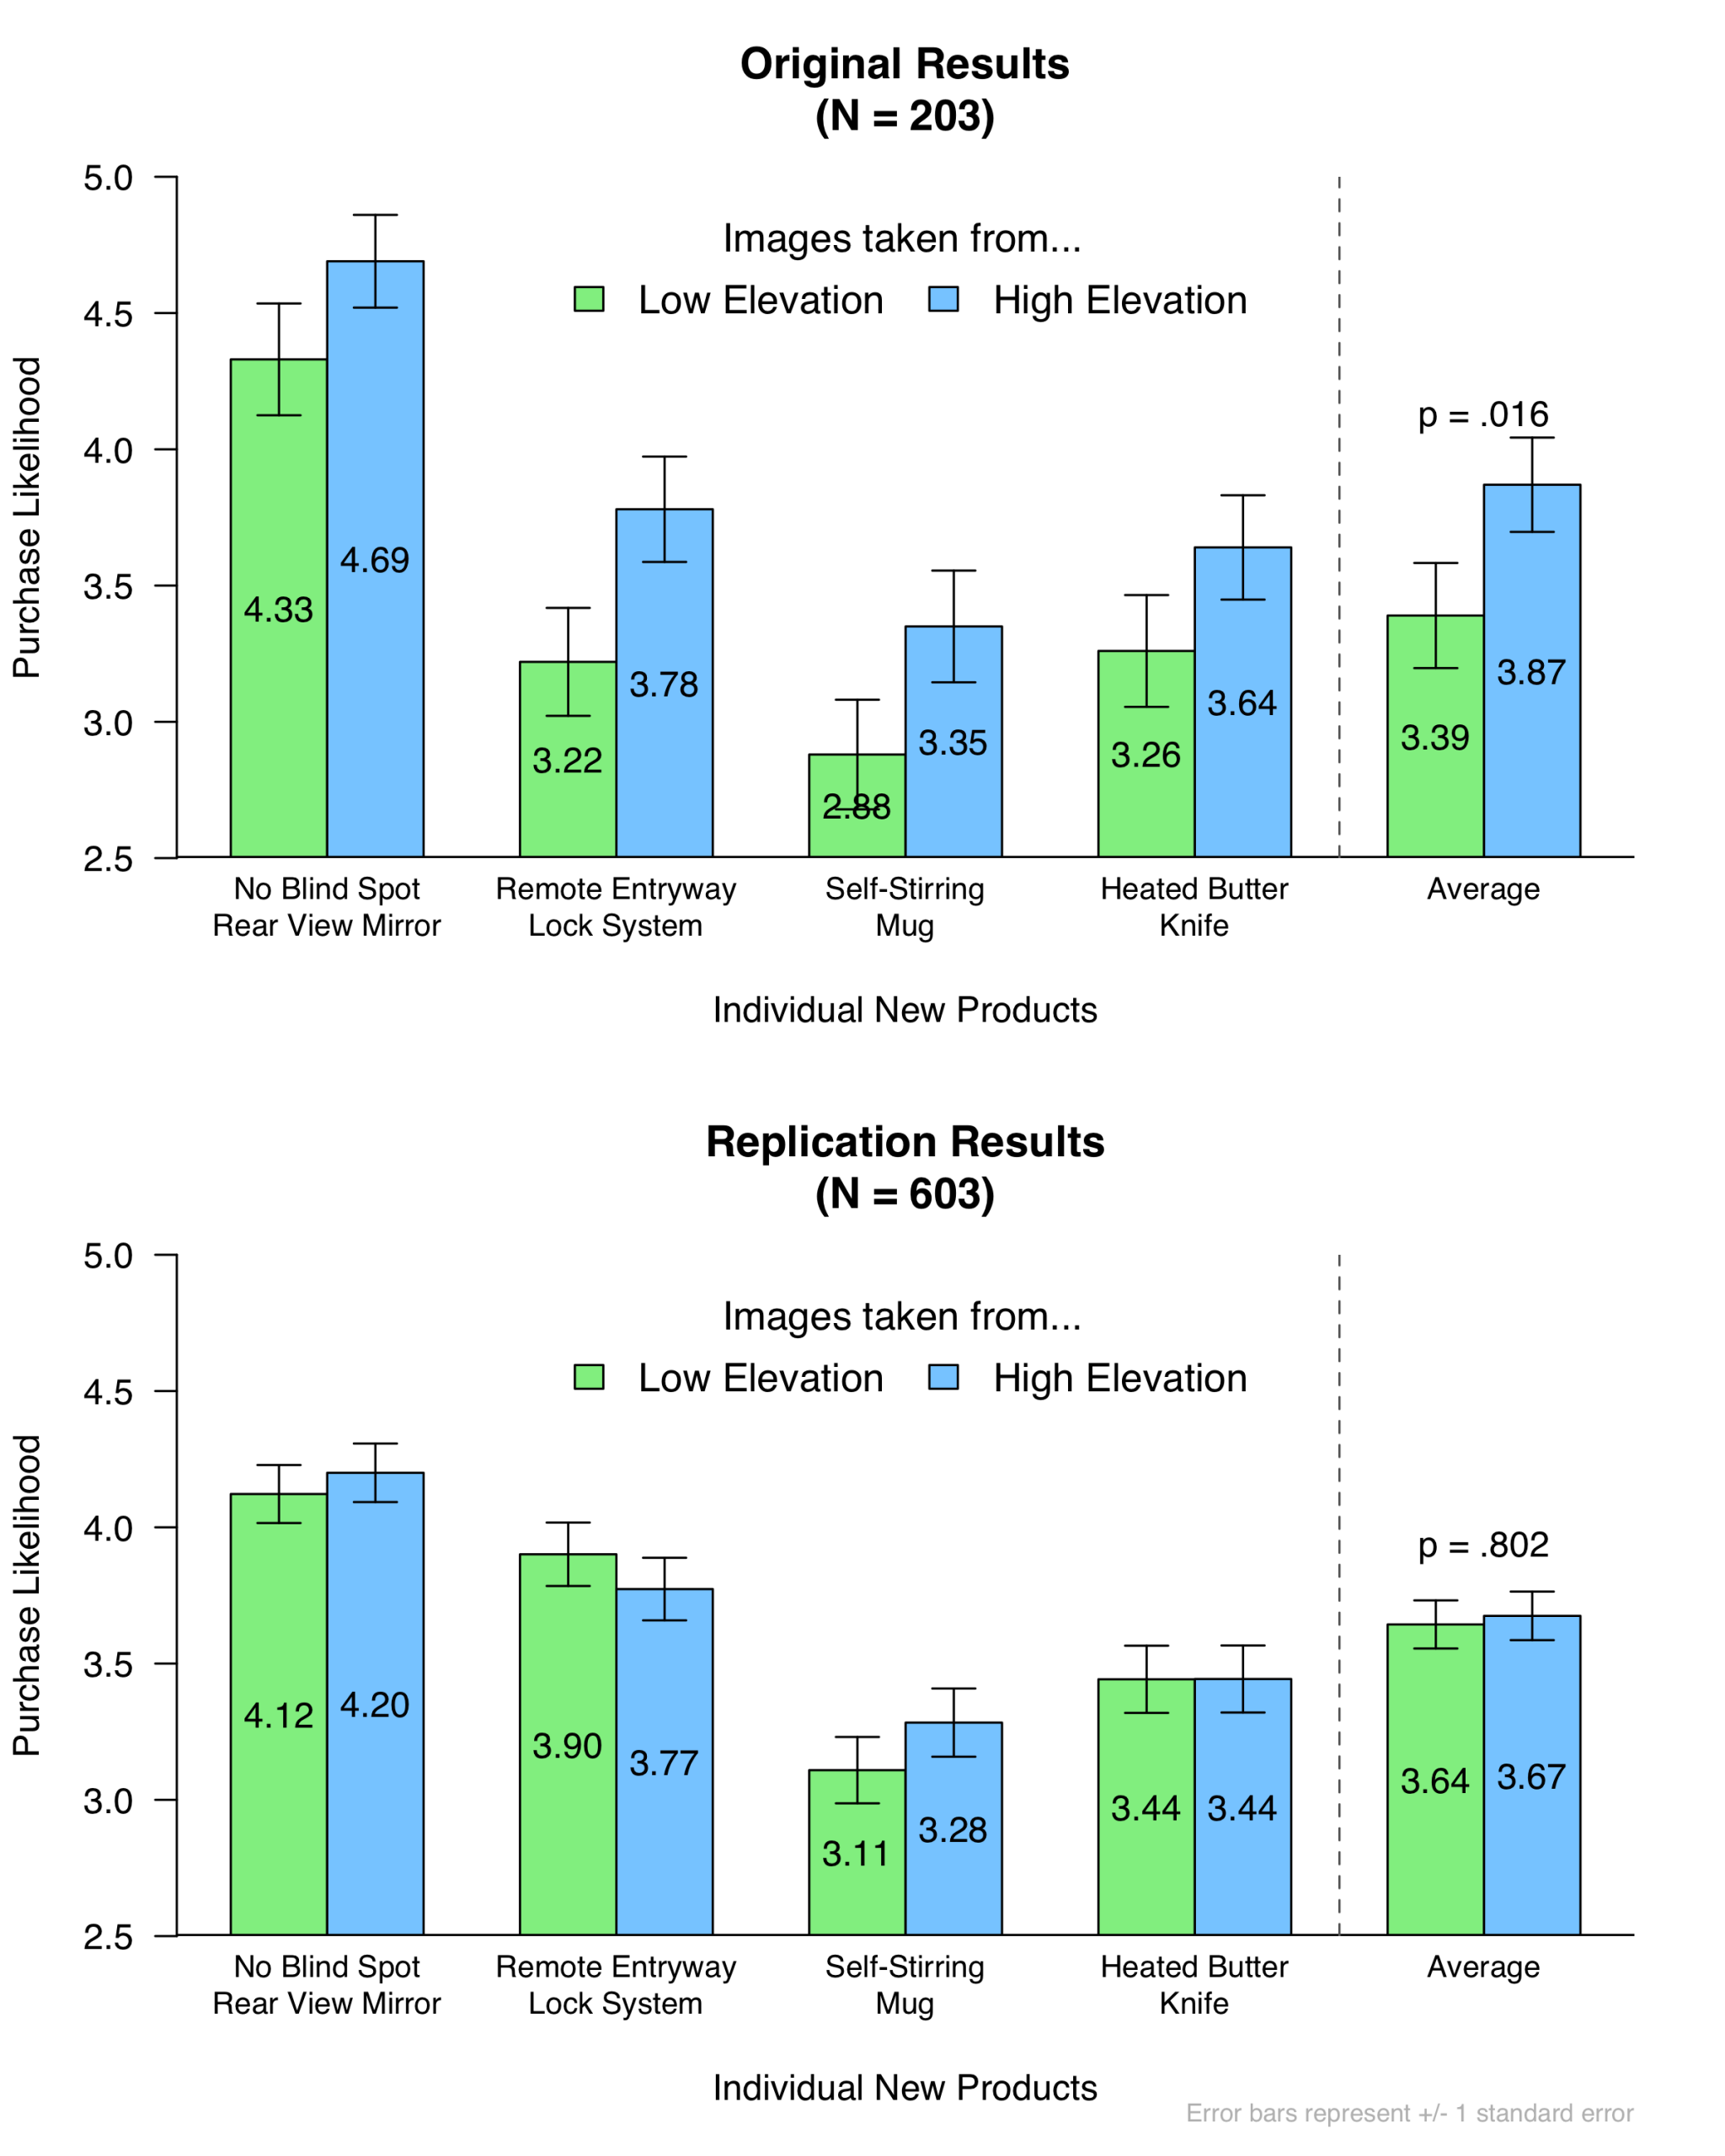
Here are the original results, as well as our replication results:
There are at least two ways to evaluate the results of replications.
First, we can ask whether the predicted result is significant in the (larger-sampled) replication attempt. In this case, it is not. Elevation condition did not significantly influence participants’ likelihood of purchasing the new products; indeed, the average purchase likelihood was nearly identical across the two conditions (MHIGH = 3.67, MLOW = 3.64, p = .802) [2] [3].
Second, we can consider what the results tell us about the possible size of the effect, and about the sample size that would be required to detect it. The figure below shows that our effect size estimate is d = .02, with a 90% confidence interval of [-.11, +.15].
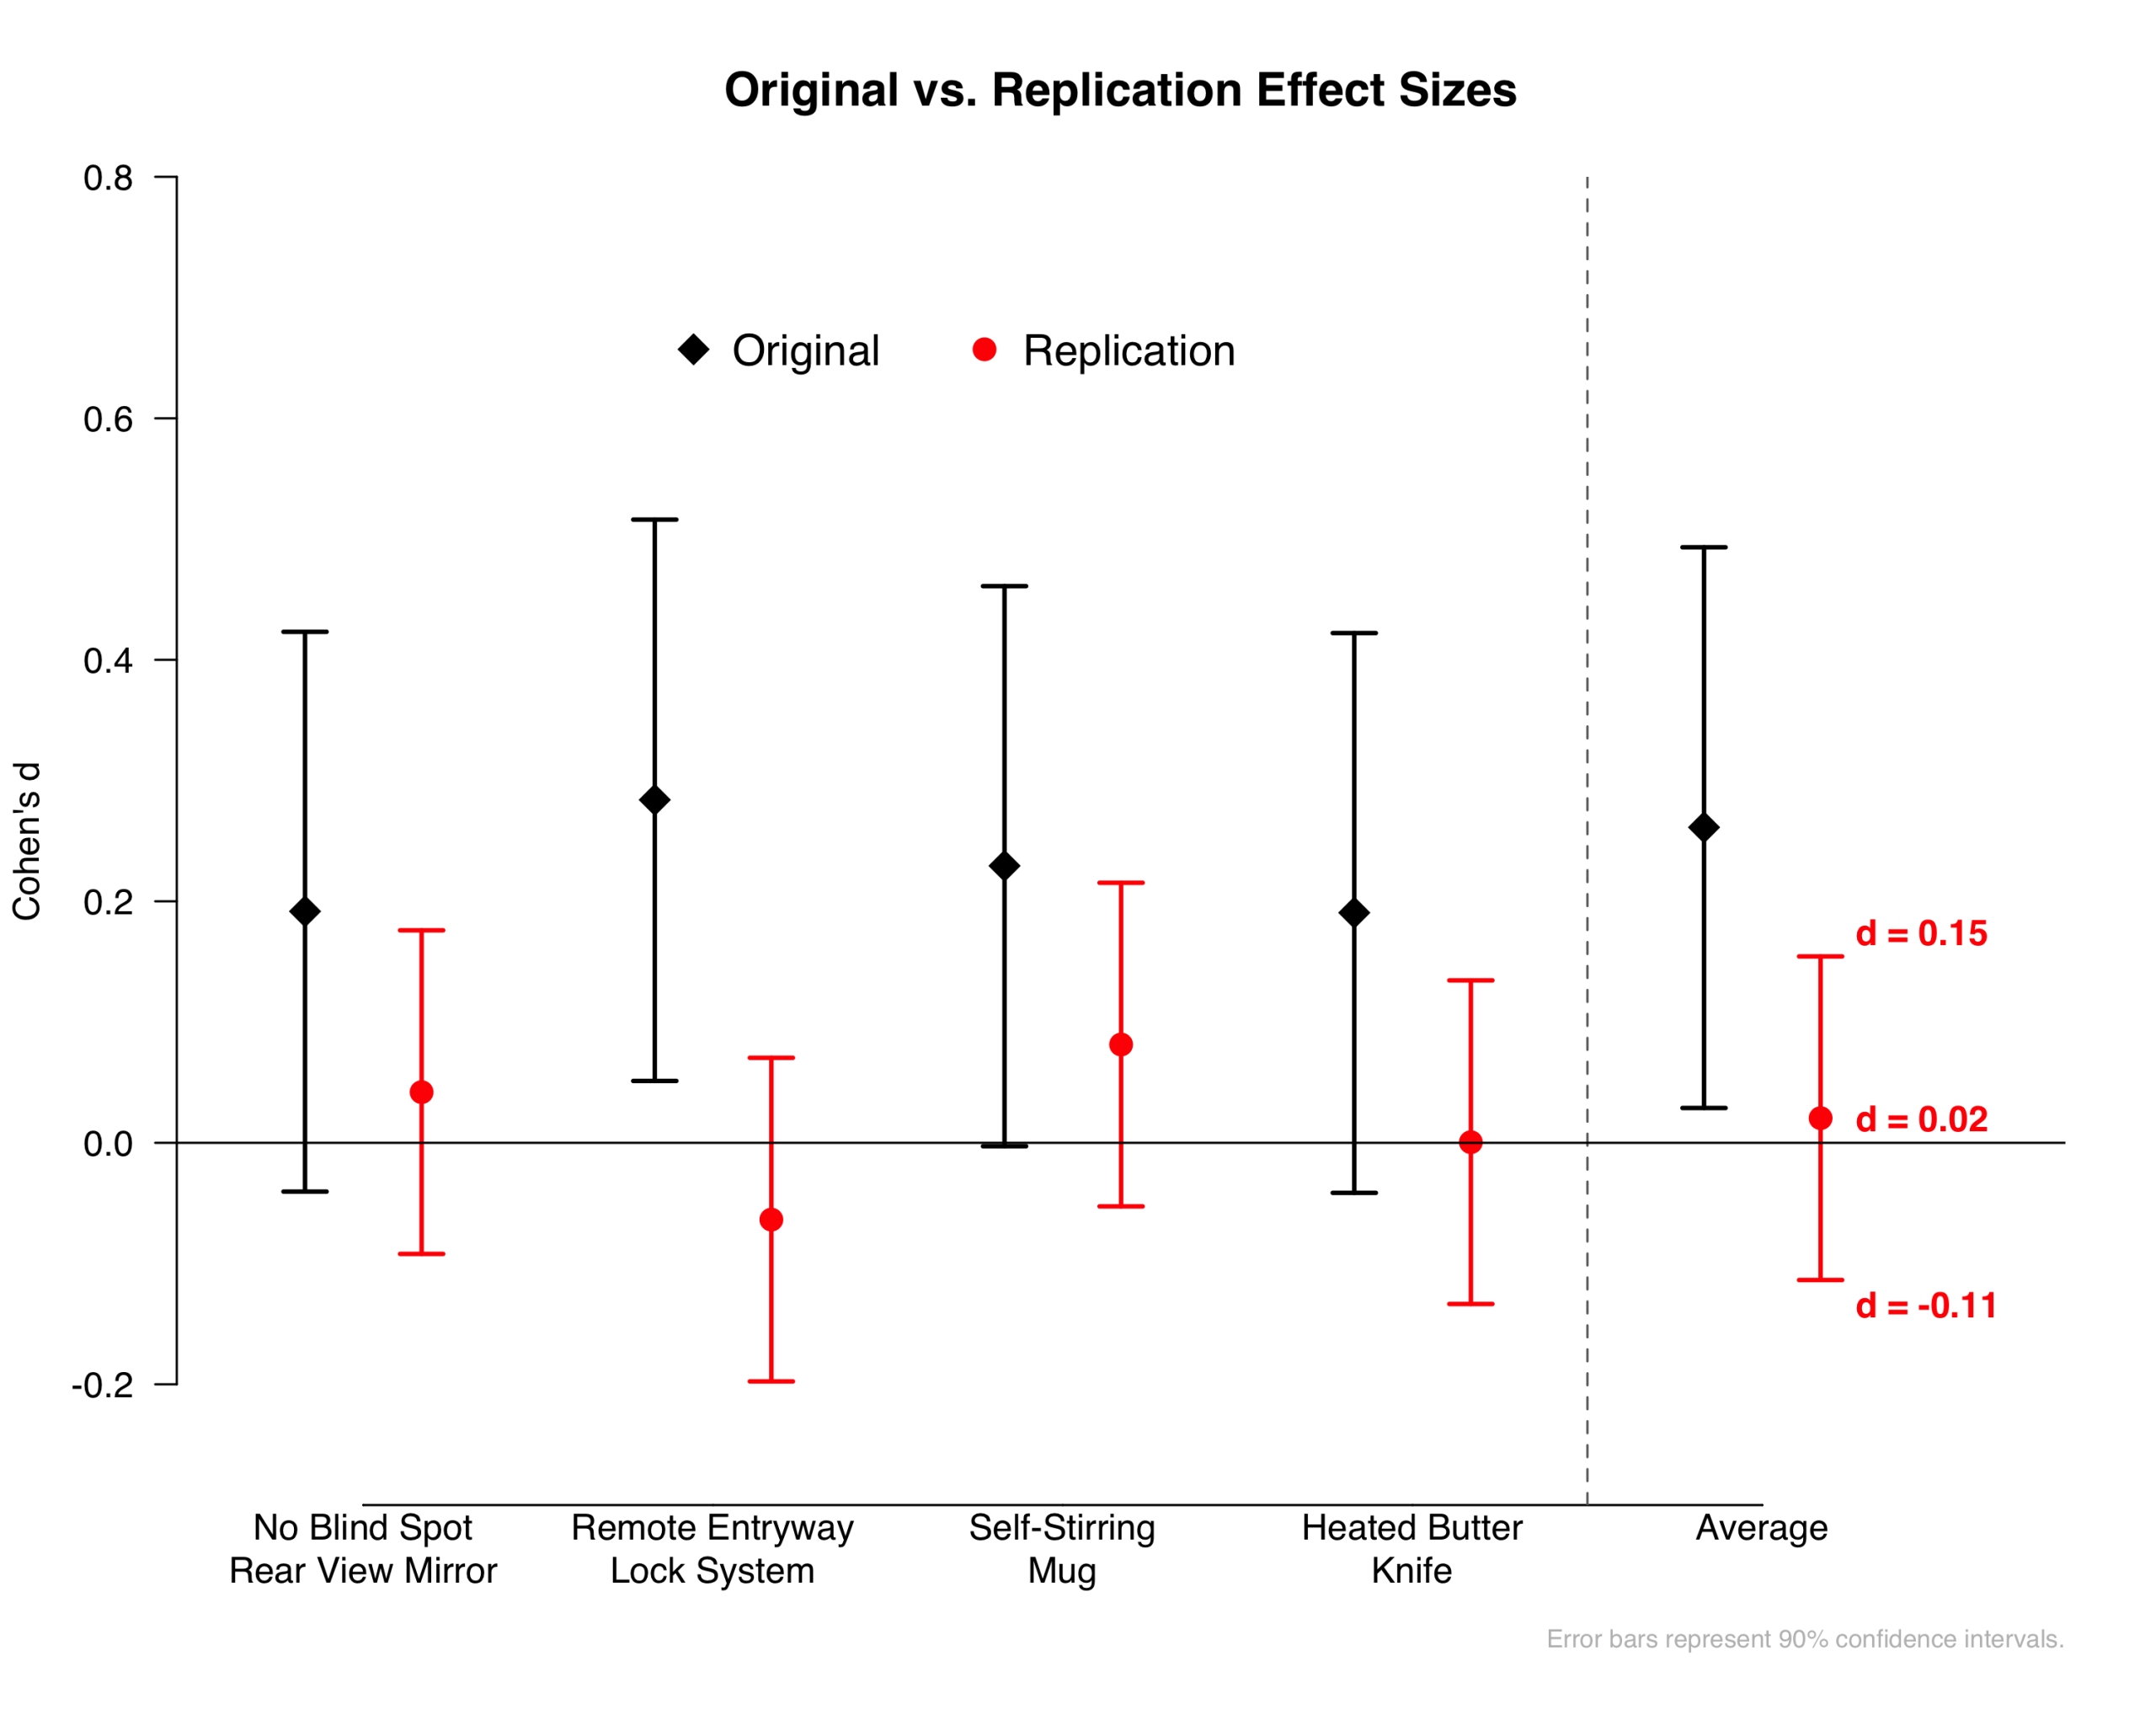
If the true effect size is at the upper boundary of our confidence interval (d = .15), then you would need 1,320 participants to have an 80% chance to detect it. If the true effect size is equal to our best estimate of the true effect size (d = .02), then you would need 75,301 participants to have an 80% chance to detect it. The original study had 203 participants, giving it only a 5.2% chance of detecting d = .02, and only a 19.4% chance of detecting d = .15. The results from the replication imply that if the effect of interest exists, the sample size used in the original study would not have been large enough to be informative.
Conclusions
In sum, using three times the sample size as the original study, we find no evidence that being exposed to an elevated vertical position increases risk taking, at least when risk is operationalized as the likelihood of purchasing new products.
![]()
Author feedback
- For any multi-study paper, a replication of a single study cannot speak directly to the replicability of any of the others. It is possible that those studies are more likely, or less likely, to replicate than the study we selected. [↩]
- We analyzed the data in two ways, both of which lead to identical results: p = .802. First, following our pre-registration, we structured the data so that each participant contributed four rows, one for each of the products they rated. We regressed their purchase likelihood rating on elevation condition, while including fixed effects for product, and clustering standard errors by participant. We also conducted the analysis the same way as the original authors did and ran a 2 (condition) x 4 (product) mixed ANOVA. [↩]
- At the end of the study, we asked participants whether they had ever completed the sceneries task on MTurk before, and whether they had ever seen the products on MTurk before (Possible answers: No, Maybe, Yes). Restricting the analyses to those participants who answered “No” to both of these questions (N = 501) causes the direction of the effect to reverse (so it is opposite of the original), while remaining nonsignificant (p = .511). [↩]