For this post, the third in a series on Bayes factors (.htm), I wanted to get a sense for how Bayes factors were being used with real data from real papers, so I looked at the 10 most recent empirical papers in Psychological Science containing the phrase "Bayes factor" (.zip). After browsing them all, I re-analyzed data from the first three. The picture is not encouraging. Bayes factors are leading inconclusive findings to be misinterpreted as supporting the null.
General observations from the 10 papers
1) Supporting the null.
The reason most papers seem to report Bayes factors is to interpret non-significant findings as supporting the null. This makes it particularly important for Bayes factors to distinguish between informative and uninformative studies. But they don't.
2) Bayes factors are like 401(k) plans.
Software that computes Bayes factors comes with arbitrary default ‘alternative hypotheses’ that are pitted against the null. Bayesian advocates propose, especially when these defaults are criticized, that researchers can easily replace them. But they don’t. All 10 Psych Science papers used a default alternative.
Anyway. Let's look at some data.
R Code to reproduce all calculations in post.
Paper 1 (.htm).
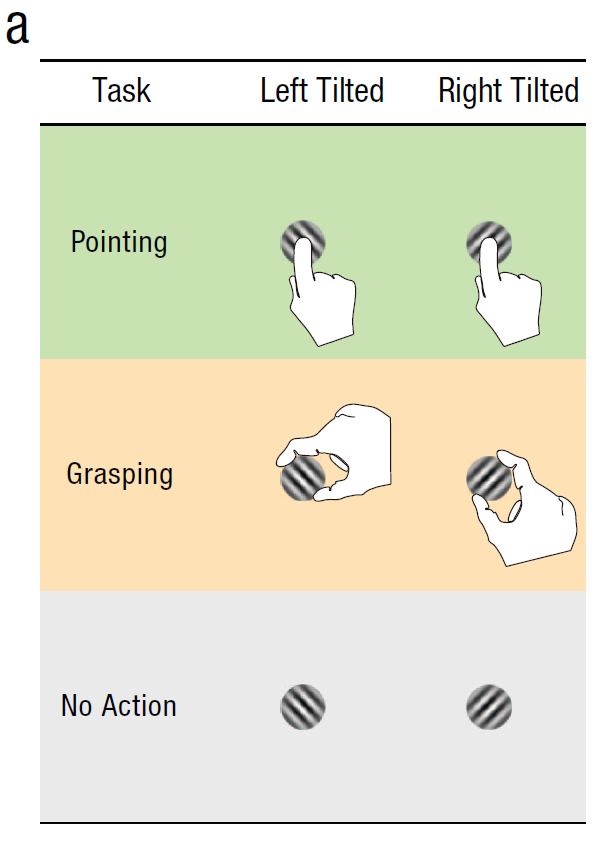
In Study 2a in this first paper, sixteen participants had to either point at, or grasp, tilted objects. The authors measured errors made by participants in tasks associated with pointing vs grasping when the objects tilted left vs right.
The authors document a non-significant effect of tilt-direction on pointing-errors. To examine if this non-significant effect "supported the null", the authors run a Bayes factor concluding that it does. The key paragraph, for our purposes:
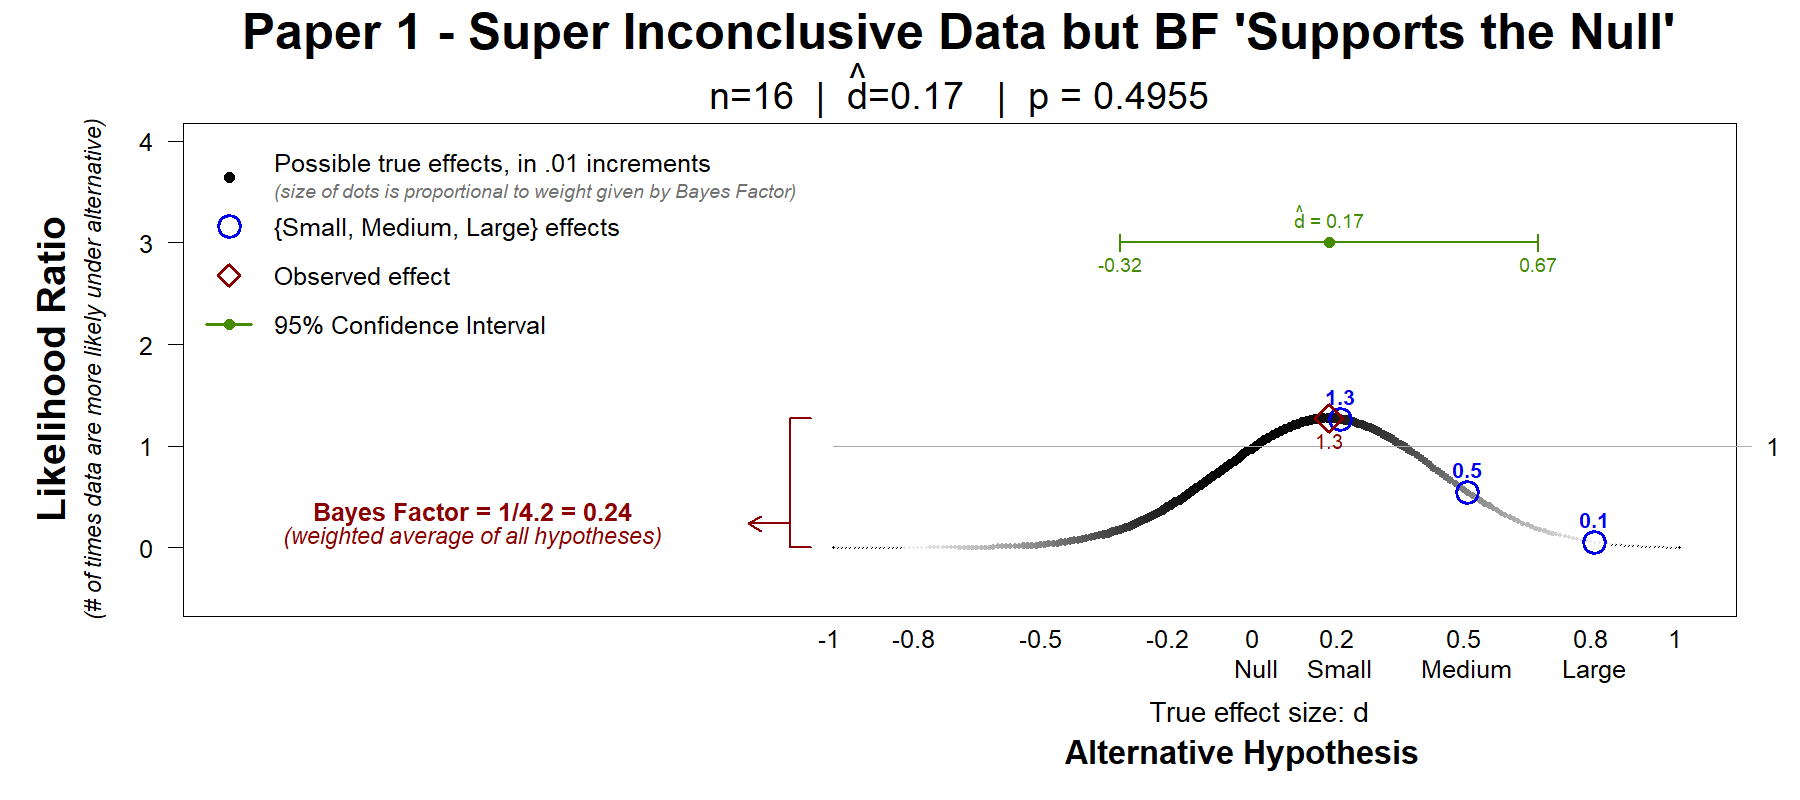
A Bayes factor of BF=4.2 means that the data are 4.2 times more consistent with the null than “the alternative.” The authors followed directions in the Bayesian-methods papers they cite, and since BF>3, they told readers the data 'support the null'. That's what they mean by saying the two means are ‘equivalent’.
Below we see a Hyp-Chart (introduced in Colada[78b]). Hyp-charts show how much more likely the data are under every possible true effect, vs under the null. The Bayes factor is but an average of the values in Hyp-chart.
First, let’s look at a contrast that I find useful. Do the data more strongly support that the effect is zero or that the effect is small (dtrue=.2)? The first blue circle answers that question. It shows a ratio of 1.3, which means the data are 30% more likely if the true effect is small than if it is zero. Directionally away from zero, but not super impressive a difference.
Let’s now look at another contrast I find useful. The confidence interval… See green line in the figure. The data do not rule out a big positive effect (+.67) nor a moderately sizable negative effect (-.32). The study is simply not informative about this effect.
But, the Bayes factor did not tell Psych Science readers the data are inconclusive.
The Bayes factor told Psych Science readers that the data “support the null.”
Paper 2 (.htm).
In this paper the authors measured skin conductance and heart rate after participants partook in a card game.
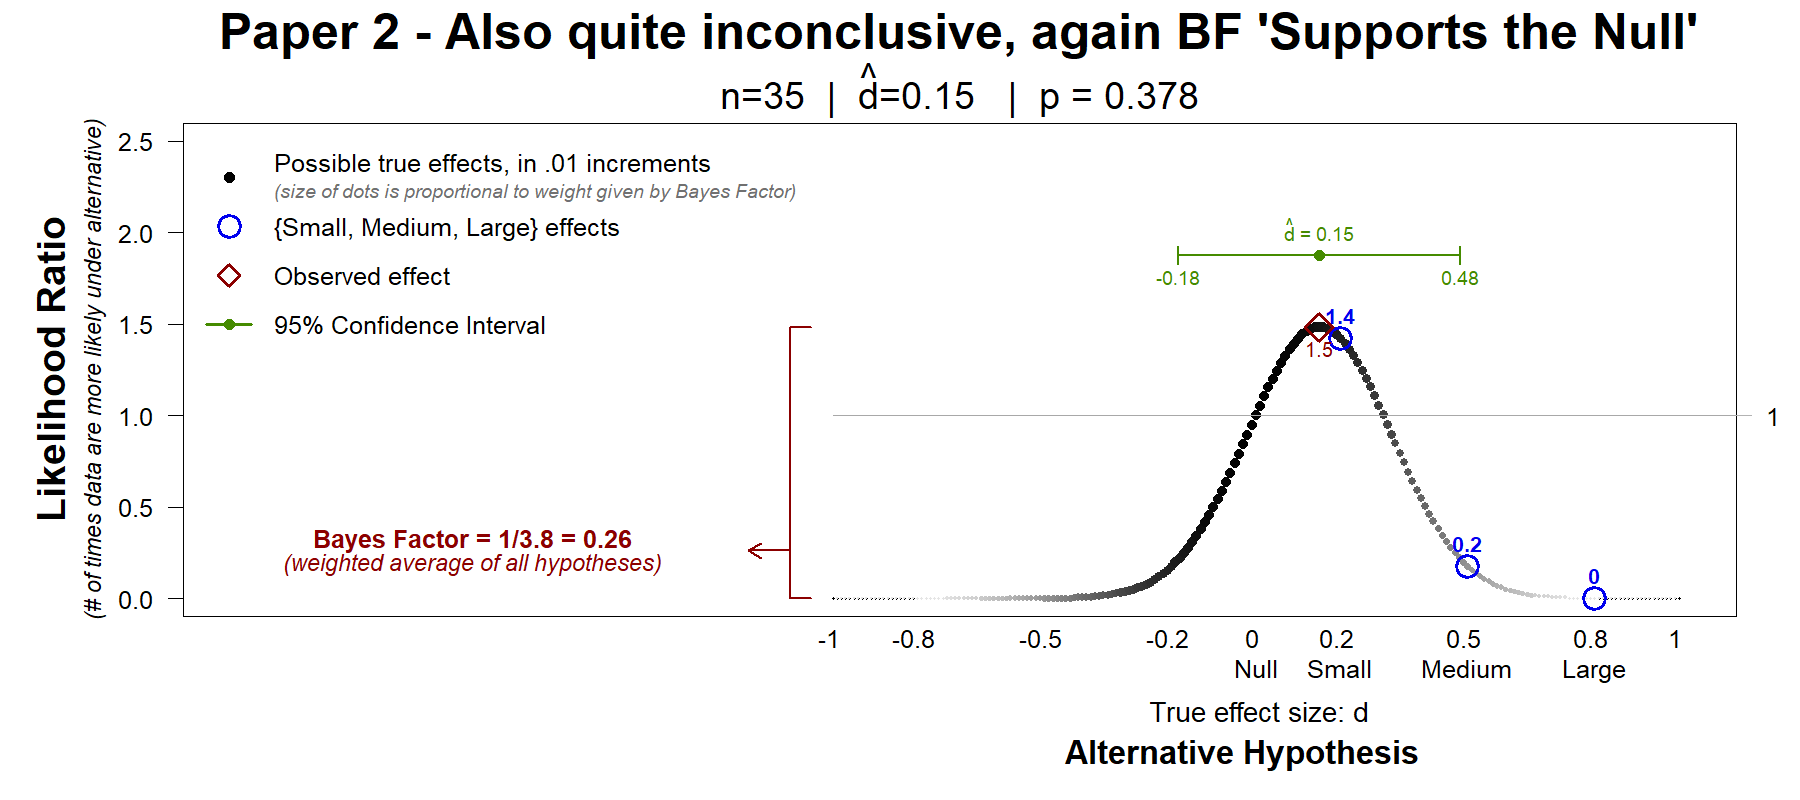
There was no significant effect on the heart rate. To see if this non-significant effect supported the null, the authors run a Bayes factor. Here too the data are noisy and inconclusive, and here too the Bayes factor, with its arbitrary default hypothesis, "supports the null".
The data are consistent with negative small effects (d=-.18) and with positive medium effects (d=.48). They do not support the null. They are inconclusive.
Paper 3 (this one is different)
This paper reports on several experiments examining if young children exhibit positive and/or negative reciprocity.
The children have an avatar and play with 4 confederates. In the positive reciprocity condition they have a 'sticker' and need to choose whom to give it to.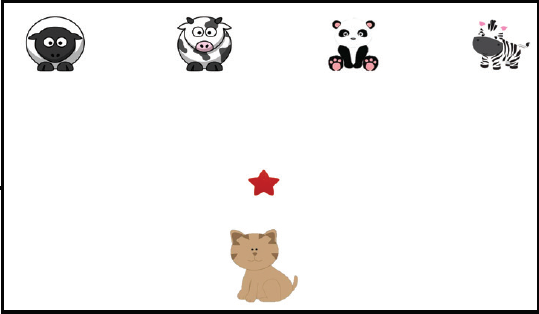
One of the confederates (e.g., the cow), previously gave a sticker to the participant (the cat), the dependent variable is thus the share of kids that reciprocate and give the sticker, the star, to the cow. The null hypothesis is that there is no reciprocity so that the cow gets 25% of the stickers.
The observed rate, 28%, was not significantly different from the null of 25%. Does this non-significant effect support the null?
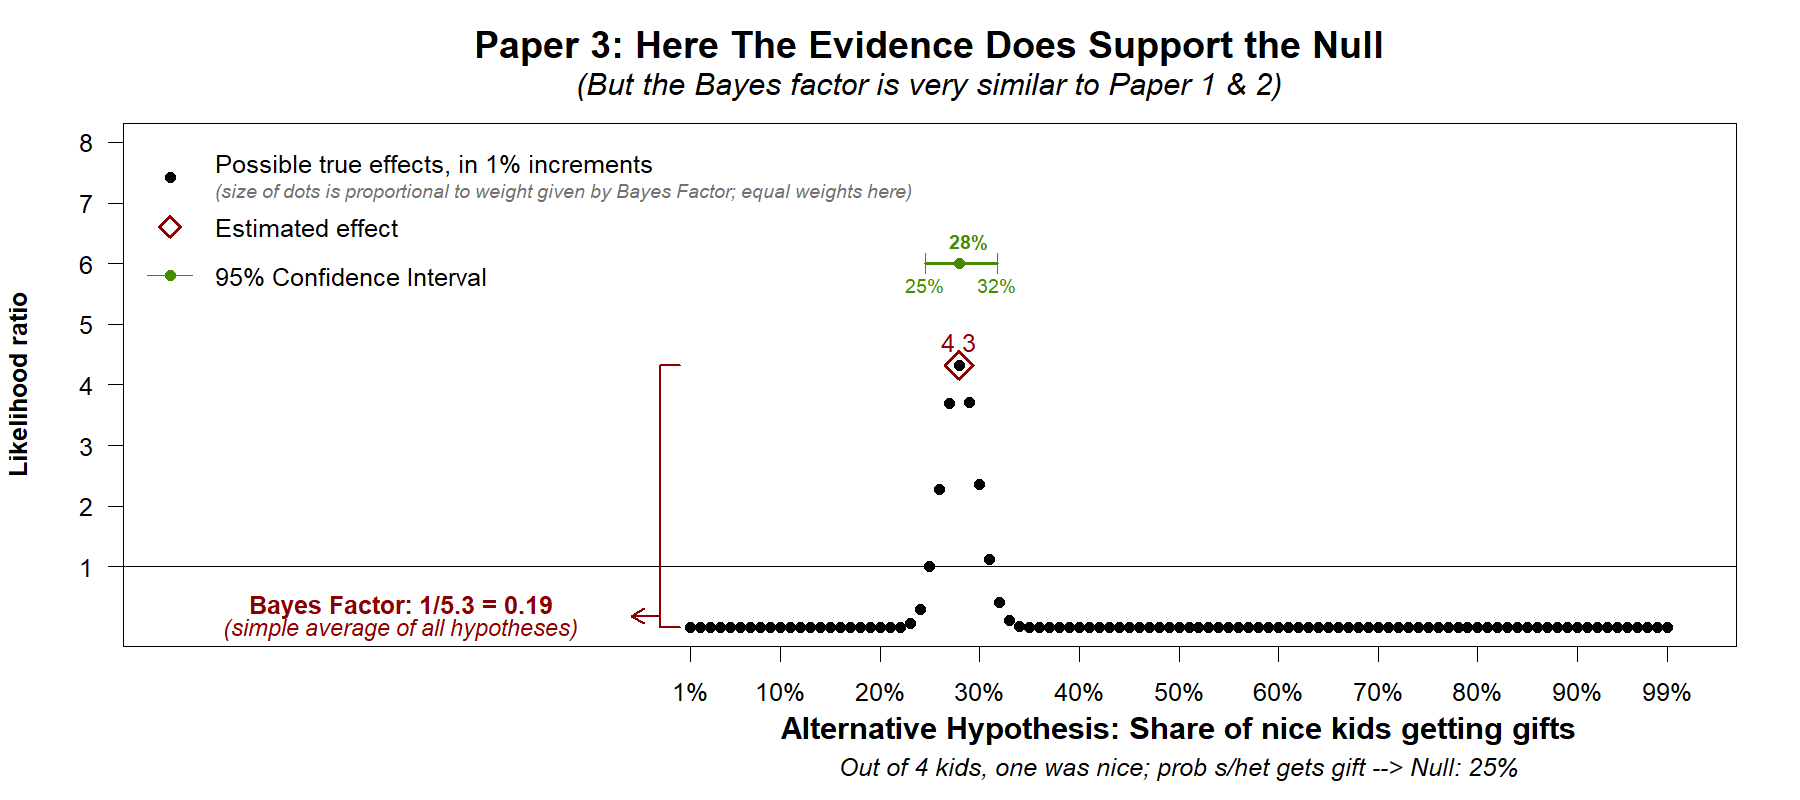
As in the previous two papers, the Bayes factor was used to answer this question. The answer was quantitatively similar to the one provided in the previous papers. In Papers 1 & 2 the Bayes factor was .24 and .26. In Paper 3 the Bayes factor was .19. All are around .2, all are lower than 1/3, the suggested reference point for interpreting data as supporting the null.
But in contrast to the similarity of the Bayes factor to the ones found in Studies 1 and 2, in this paper the evidence does rule out (statistically speaking) most or perhaps all effects large enough to be of interest.
The confidence interval, which was also reported in the paper itself, rejects the cow getting anything above 32%. And Hyp-Chart, tells the same story: the data are most consistent with nil to trivially small reciprocity.
Now, it is possible that for you, or for another reader, 30% of stickers going to the cow, instead of 25%, is not seen as trivial, and thus is not seen as supporting the null of no reciprocity. How much reciprocity is interesting is a conceptual not a statistical question. Hyp-Charts and confidence intervals allow each reader to decide what is big enough to care about. Bayes factors do not. They reduce and distort the information in our data, and tell readers what to think leaving the justification in a black box under the rug.
Aside: Paper 3 does find evidence supporting negative reciprocity. Kids take away stickers from cows that took sticker from them.
Conclusion
When a Bayes factor ‘supports the null’ you cannot tell if the data actually suggest the absence of an effect, or if the Bayes factor is distorting the evidence and presenting uninformative results as if they were informative. Default Bayes factors are legitimizing the fallacy that not-significant=> null is true.
If a Bayes factor is to be included in a paper, adding a Hyp-Chart is likely to help readers evaluate its summary of the data.
Editors, authors, reviewers, and readers: beware.
![]()
Author feedback: I shared a draft of this post with the authors of the three Psych Science papers I re-analyzed. The authors of the third paper responded and provided very useful feedback that made my description of their analyses more accurate and complete. Bence Pálfi (.htm), as with Colada[78b], provided valuable feedback despite having a different overall assessment of Bayes factors.

