In this post, we first consider how plausible it is for researchers to engage in more ambitious p-hacking (i.e., past the nominal significance level of p<.05). Then, we describe how we have modified p-curve (see app 4.0) to deal with this possibility.
Ambitious p-hacking is hard.
In “False-Positive Psychology” (SSRN), we simulated the consequences of four (at the time acceptable) forms of p-hacking. We found that the probability of finding a statistically significant result (p<.05) skyrocketed from the nominal 5% to 61%.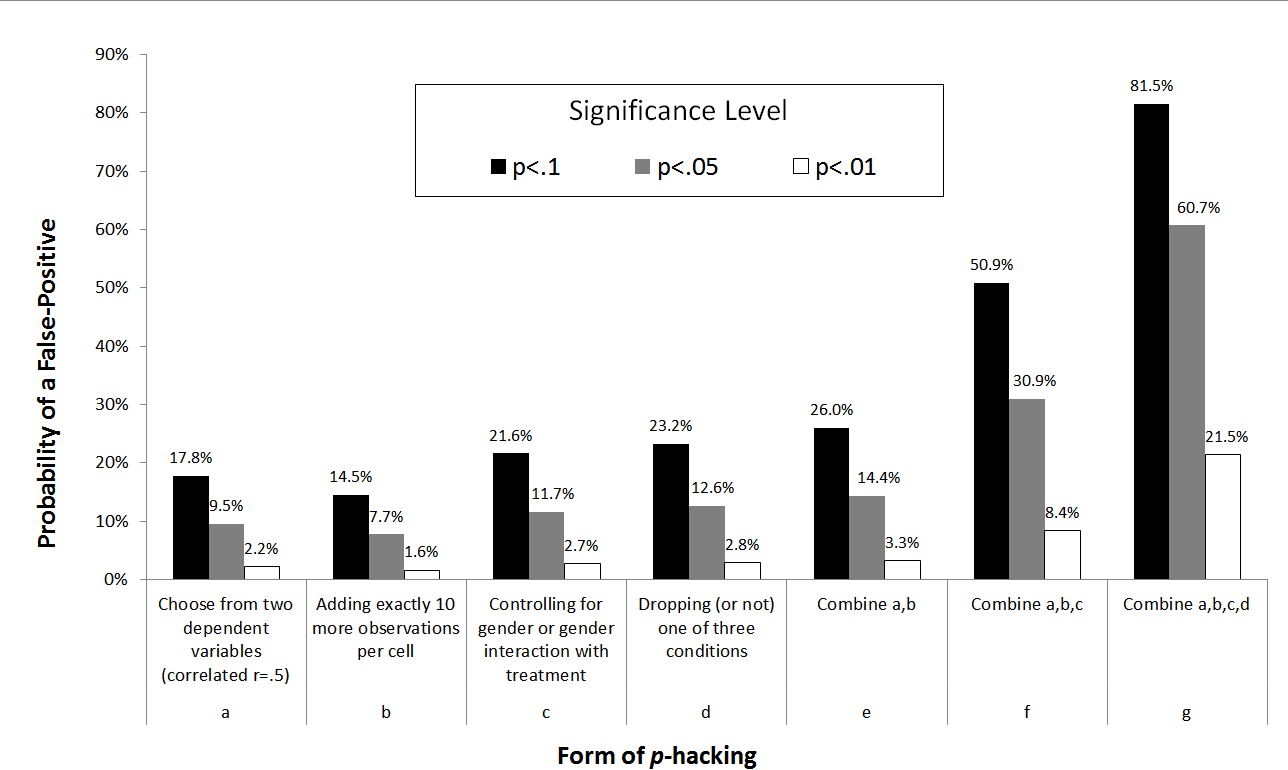
For a recently published paper, “Better P-Curves” (.pdf), we modified those simulations to see how hard it would be for p-hackers to keep going past .05. We found that p-hacking needs to increase exponentially to get smaller and smaller p-values. For instance, once a nonexistent effect has been p-hacked to p<.05, a researcher would need to attempt nine times as many analyses to achieve p<.01.
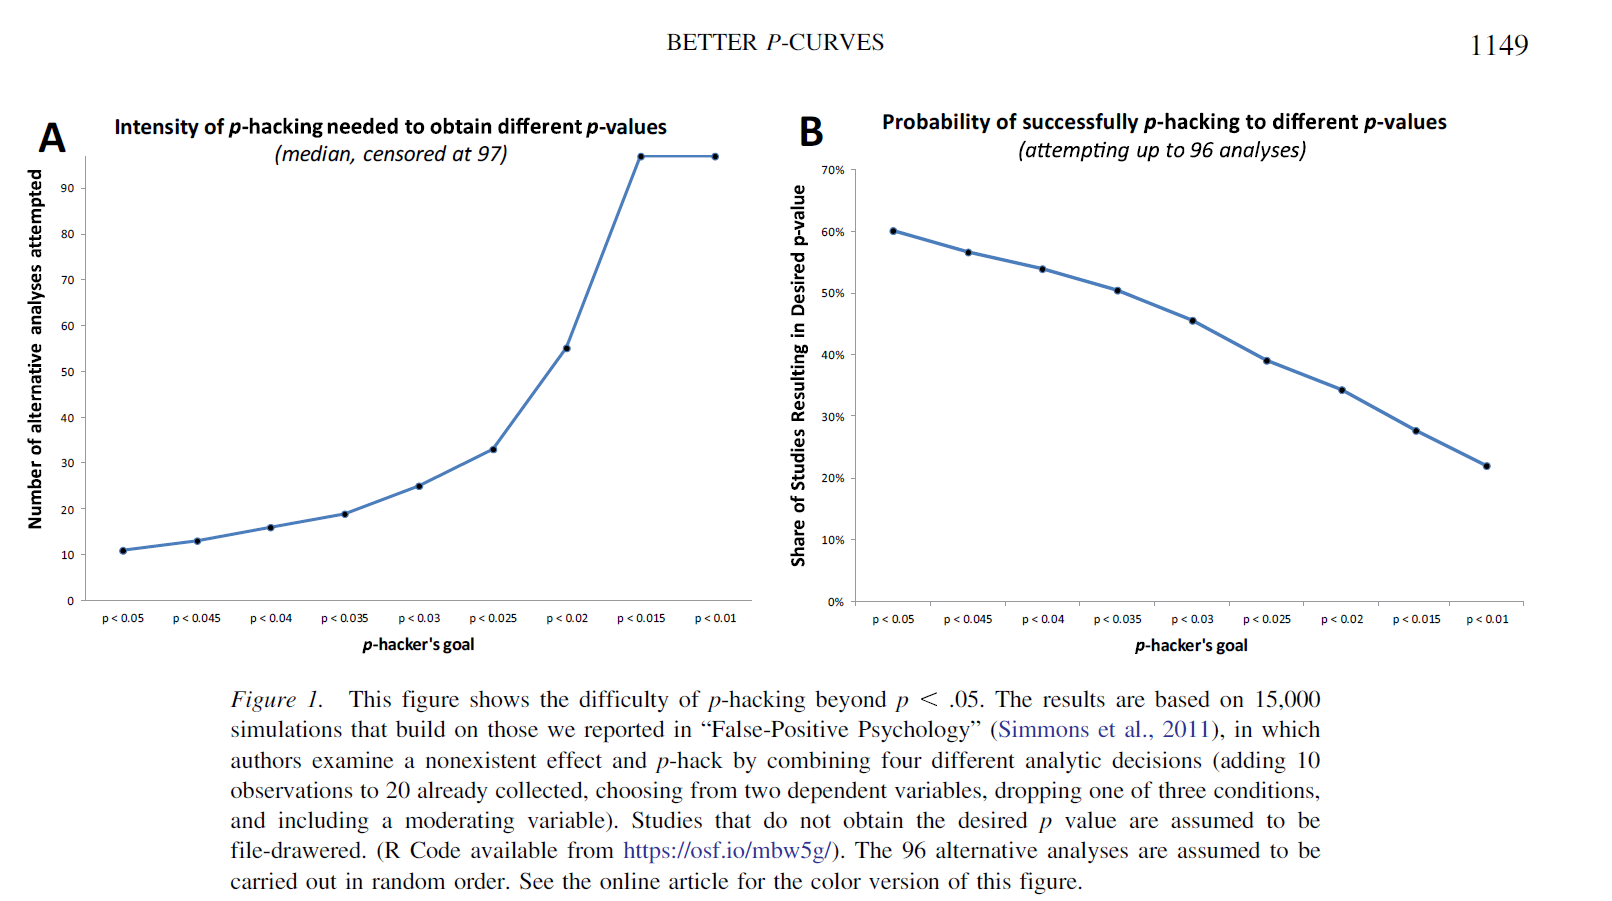
Moreover, as Panel B shows, because there is a limited number of alternative analyses one can do (96 in our simulations), ambitious p-hacking often fails.[1]
P-Curve and Ambitious p-hacking
P-curve is a tool that allows you to diagnose the evidential value of a set of statistically significant findings. It is simple: you plot the significant p-values of the statistical tests of interest to the original researchers, and you look at its shape. If your p-curve is significantly right-skewed, then the literature you are examining has evidential value. If it’s significantly flat or left-skewed, then it does not.
In the absence of p-hacking, there is, by definition, a 5% chance of mistakenly observing a significantly right-skewed p-curve if one is in fact examining a literature full of nonexistent effects. Thus, p-curve’s false-positive rate is 5%.
However, when researchers p-hack trying to get p<.05, that probability drops quite a bit, because p-hacking causes p-curve to be left-skewed in expectation, making it harder to (mistakenly) observe a right-skew. Thus, literatures studying nonexistent effects through p-hacking have less than a 5% chance of obtaining a right-skewed p-curve.
But if researchers get ambitious and keep p-hacking past .05, the barely significant results start disappearing and so p-curve starts having a spurious right-skew. Intuitively, the ambitious p-hacker will eliminate the .04s and push past to get more .03s or .02s. The resulting p-curve starts to look artificially good.
Updated p-curve app, 4.0 (htm), is robust to ambitious p-hacking
In “Better P-Curves” (.pdf) we introduced a new test for evidential value that is much more robust to ambitious p-hacking. The new app incorporates it (it also computes confidence intervals for power estimates, among many other improvements, see summary (.htm)).
The new test focuses on the “half p-curve,” the distribution of p-values that are p<.025. On the one hand, because half p-curve does not include barely significant results, it has a lower probability of mistaking ambitious p-hacking for evidential value. On the other hand, dropping observations makes the half p-curve less powerful, so it has a higher chance of failing to recognize actual evidential value.
Fortunately, by combining the full and half p-curves into a single analysis, we obtain inferences that are robust to ambitious p-hacking with minimal loss of power.
The new test of evidential value:
A set of studies is said to contain evidential value if either the half p-curve has a p<.05 right-skew test, or both the full and half p-curves have p<.1 right-skew tests. [2]
In the figure below we compare the performance of this new combination test with that of the full p-curve alone (the “old” test). The top three panels show that both tests are similarly powered to detect true effects. Only when original research is underpowered at 33% is the difference noticeable, and even then it seems acceptable. With just 5 p-values the new test still has more power than the underlying studies do.
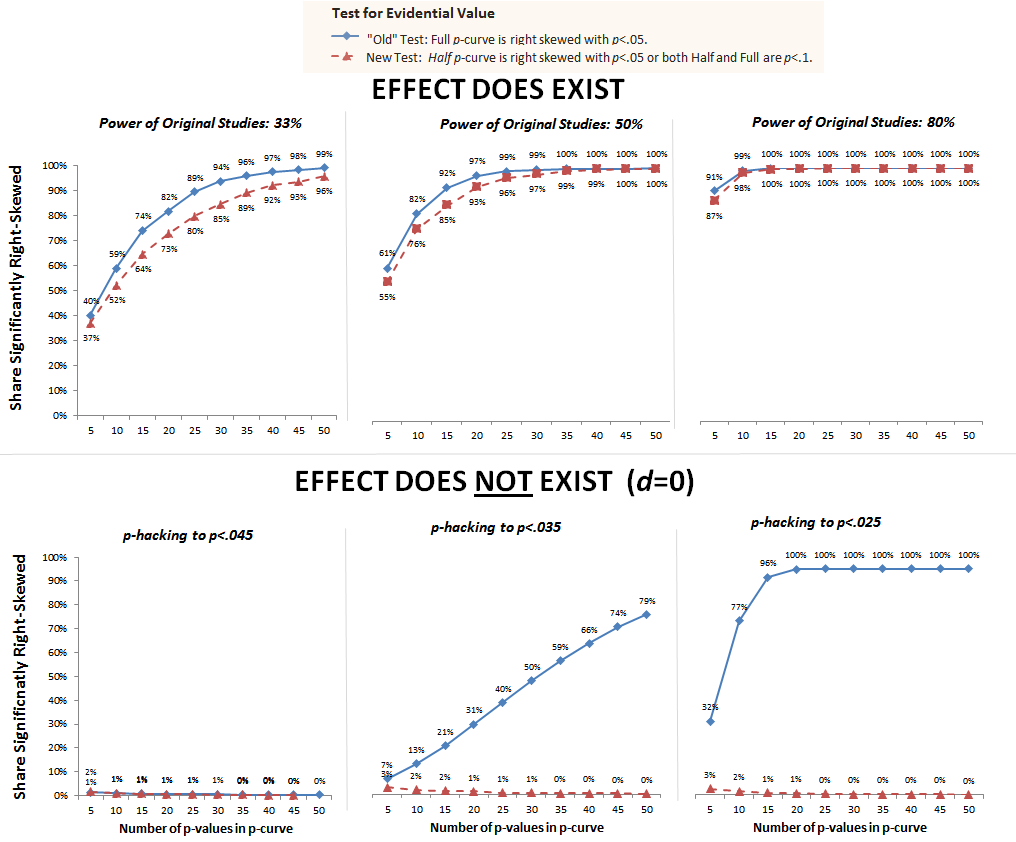
The bottom panels show that moderately ambitious p-hacking fully invalidates the “old” test, but the new test is unaffected by it.[3]
We believe that these revisions to p-curve, incorporated in the updated app (.html), make it much harder to falsely conclude that a set of ambitiously p-hacked results contains evidential value. As a consequence, the incentives to ambitiously p-hack are even lower than they were before.
![]()
Footnotes.
- This is based on simulations of what we believe to be realistic combinations and levels of p-hacking. The results will vary depending on the types and levels of p-hacking.[↩]
- As with all cutoffs, it only makes sense to use these as points of reference. A half p-curve with p=.051 is nearly as good as with p=.049, and both tests with p<.001 is much stronger than both tests with p=.099.[↩]
- When the true effect is zero and researchers do not p-hack (an unlikely combination), the probability that the new test leads to concluding the studies contain evidential value is 6.2% instead of the nominal 5%. R Code: https://osf.io/mbw5g/ [↩]