In the eighth installment of Data Replicada, we report our attempt to replicate a recently published Journal of Marketing Research (JMR) article entitled, “The Left-Digit Bias: When and Why Are Consumers Penny Wise and Pound Foolish?” (.htm).
In this paper, the authors offer insight into a previously documented observation known as the left-digit bias, whereby consumers tend to give greater weight to the left-most digit when comparing two prices. This means, for example, that consumers tend to treat a price difference of $4.00 vs. $2.99 as larger than $4.01 vs. $3.00 [1]. The authors’ key claim is that this bias is greater when the prices are presented side-by-side, in a way that makes them easier to compare, than sequentially, on two separate but consecutive screens.
This JMR paper contains five MTurk studies plus an additional study in which the authors analyzed scanner panel data. We chose to replicate Study 1 (N = 145) because it represented the simplest test of the authors’ hypothesis, and because its effect size was among the largest in the paper [2]. In this study, participants saw two brands of peanut butter, a premium brand and a store brand, along with their prices. The authors manipulated two factors. First, the left-digit price difference was either large ($4.00 vs. $2.99) or small ($4.01 vs. $3.00). Second, the peanut butters (and their prices) were either presented adjacently on the same screen, or one after the other on different screens. Participants evaluated the relative price of the store brand on a scale ranging from very low to very high. The researchers found that consumers showed a greater left-digit bias – evaluating the store brand to be relatively lower when it was $2.99 than when it was $3.00 – when the products and prices were presented on the same screen rather than sequentially.
We contacted the authors to request the materials needed to conduct a replication. They were extremely forthcoming, thorough, and polite. They immediately shared the original Qualtrics file that they used to conduct that study, and we used it to conduct our replication. They also promptly answered a few follow-up questions. It is also worth noting that the authors had publicly posted their data (OSF link), which allowed us to easily access key statistics and to verify that their results are reproducible (and they are). We are very grateful to them for their help, professionalism, and transparency.
The Replications
We ran two identical replications. The first was run on MTurk using the same criteria the original authors specified. The second was run on MTurk using a new feature that screens for only high-quality “CloudResearch Approved Participants” [3].
In the pre-registered replications, we used the same survey as in the original study, and therefore the same instructions, procedures, images, and questions. These studies did not deviate from the original study in any discernible way, except that our consent form was necessarily different, our exclusion rules were slightly different [4], and we added an attention check to the last page of the survey to help us measure participant quality. After exclusions, we wound up with 1,099 participants in Replication 1 (~7.5 times the original sample size) and 1,555 participants in Replication 2 (~10.7 times the original sample size) [5]. You can (easily!) access all of our pre-registrations, surveys, materials, data, and code on ResearchBox (.htm).
In each study, participants saw five pairs of products alongside their prices. Each pair was presented on its own page(s) of the survey, and included a premium brand and a store brand called Great Value. The first four product pairs – ketchup, tuna, brown rice, and mayonnaise – were filler items – and the fifth pair – peanut butter – was the critical item. For each pair participants were asked: “Compared to the premium price, the price of the store brand is . . .” (1 = Very Low; 7 = Very High).
There were two manipulations.

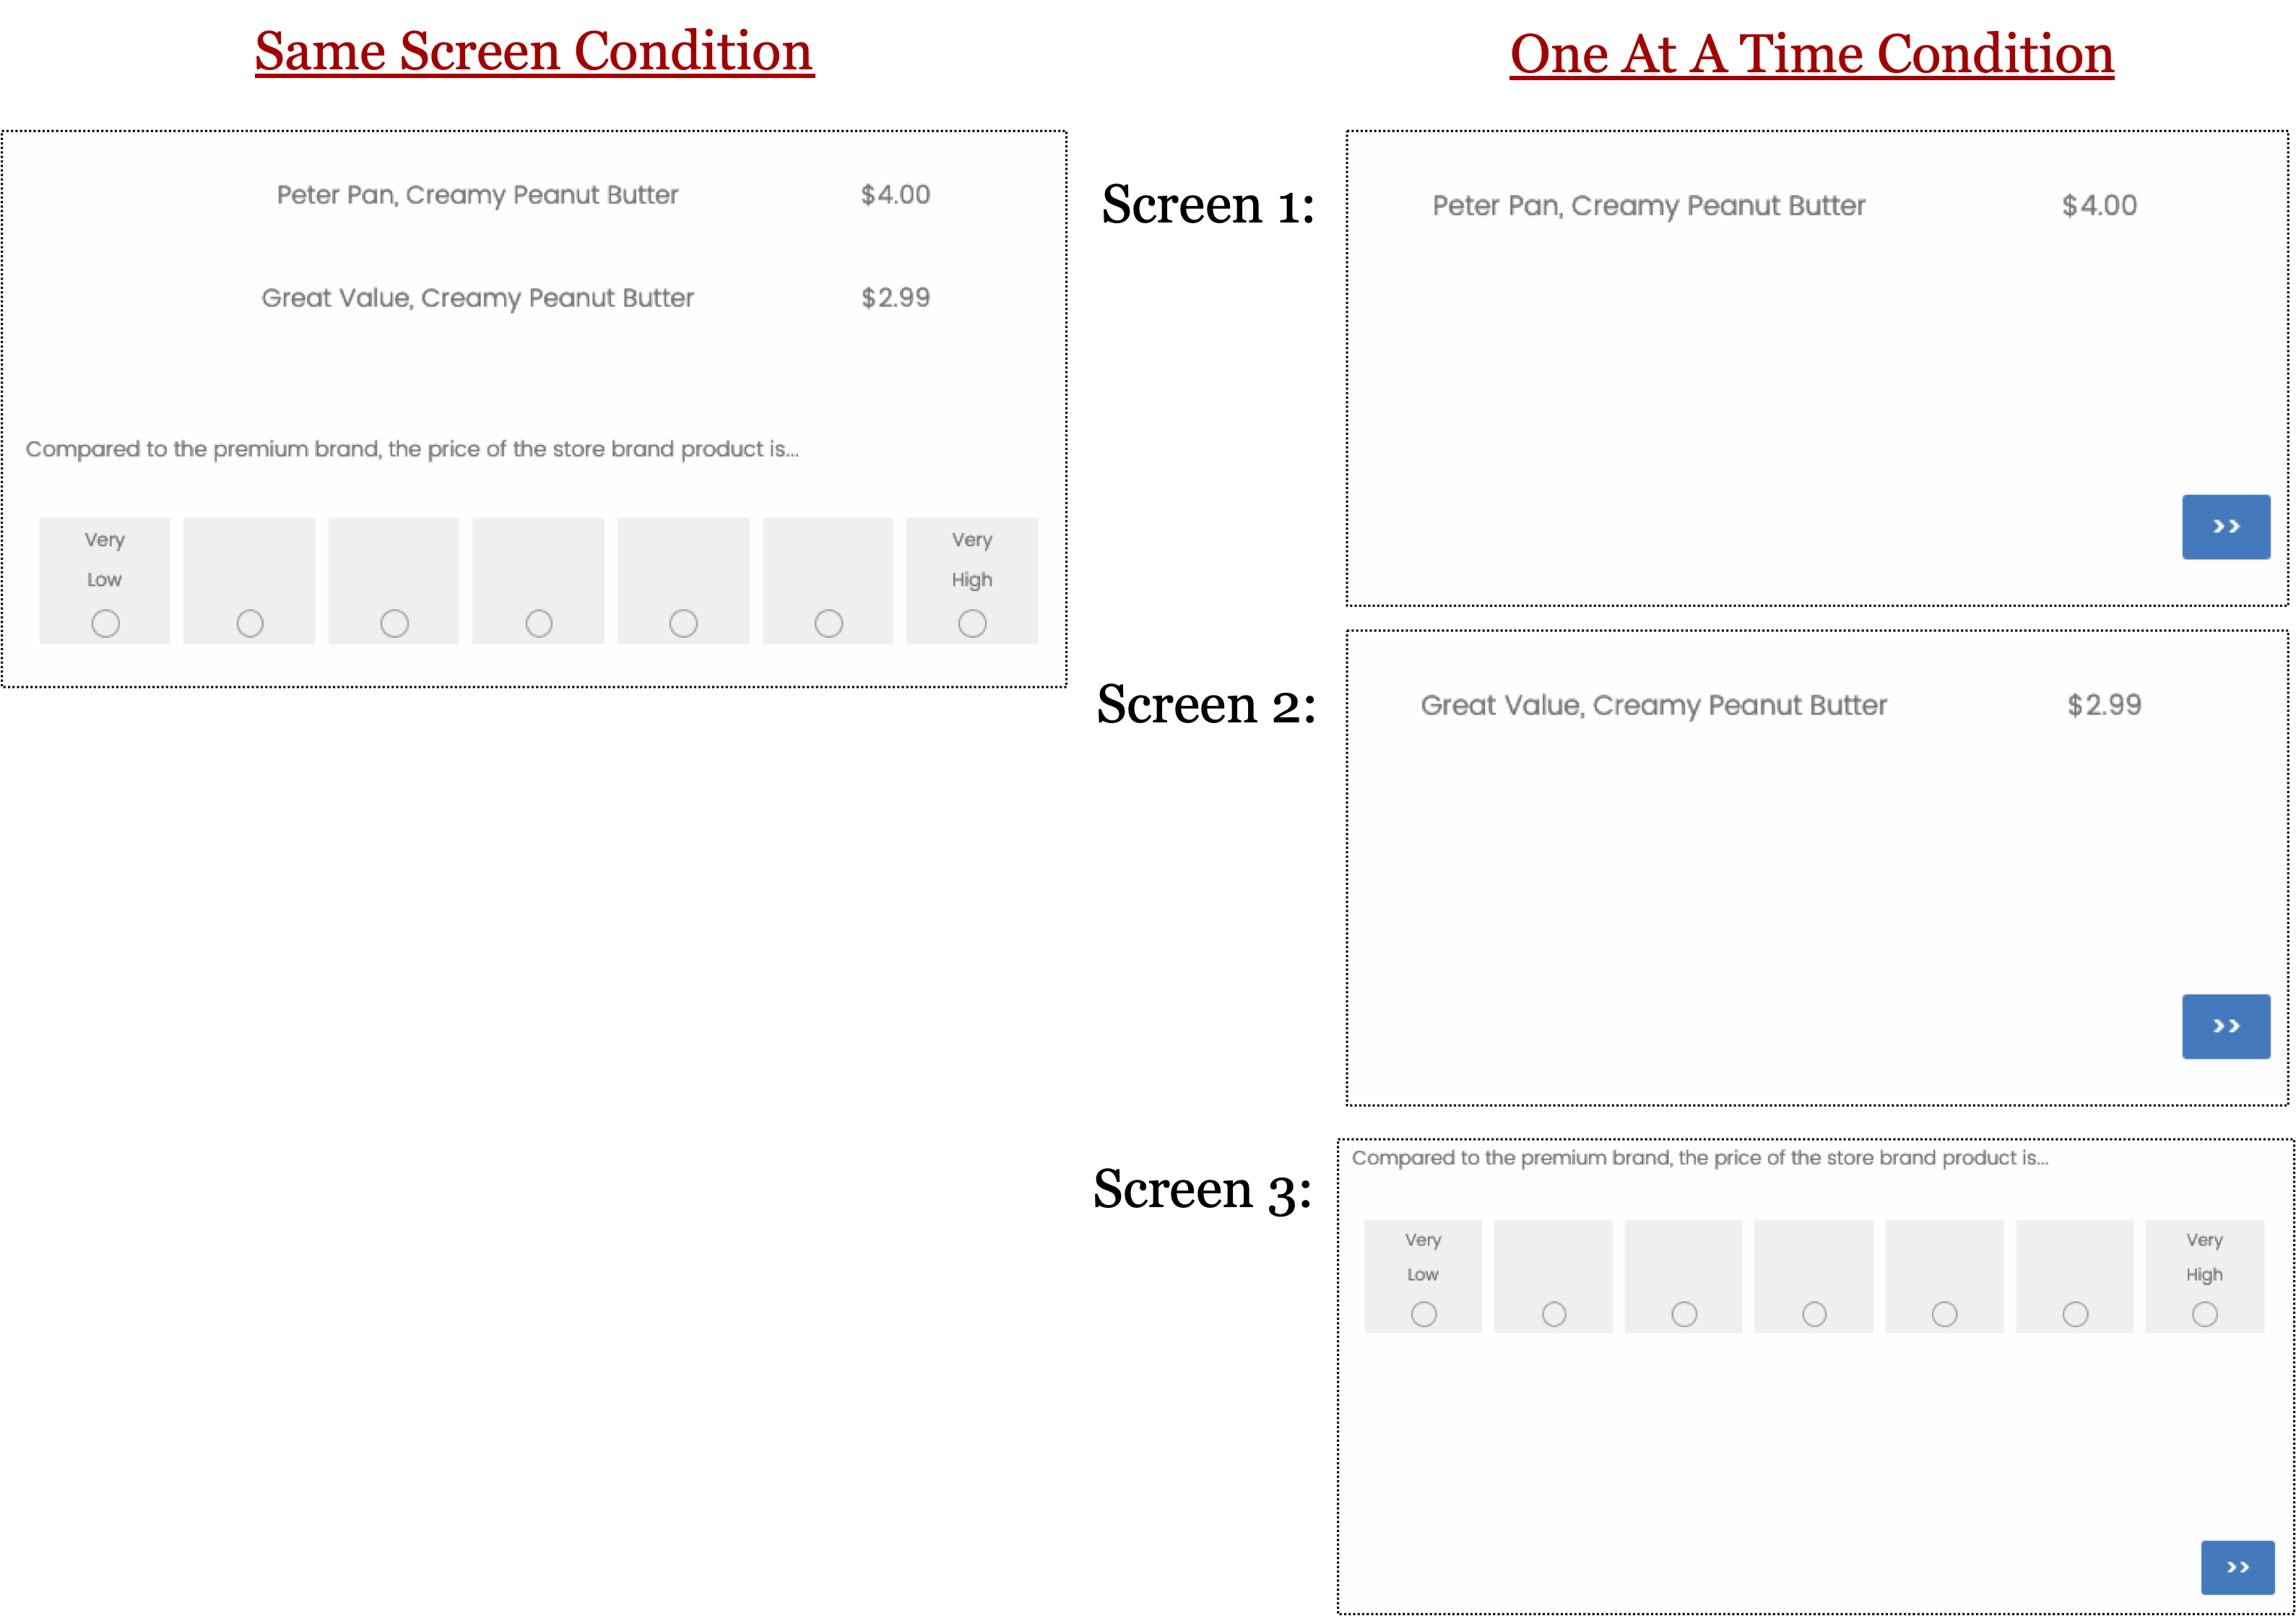
First, as shown above, participants in the “Same Screen” condition saw the two products/prices on the same screen, with the premium brand always presented above the store brand. On that same screen, participants were asked the complete the dependent measure. Those in the “One At A Time” condition instead saw the two products/prices on consecutive screens, with the premium brand always presented first and the store brand always presented second. The dependent measure was then presented on a subsequent screen [6].
Second, the prices of the peanut butters varied between conditions. In the Large Left Difference condition (shown above), the premium brand was priced at $4.00 and the store brand was priced at $2.99. In the Small Left Difference condition (not shown), the premium was priced at $4.01 and the store brand was priced at $3.00.
Results
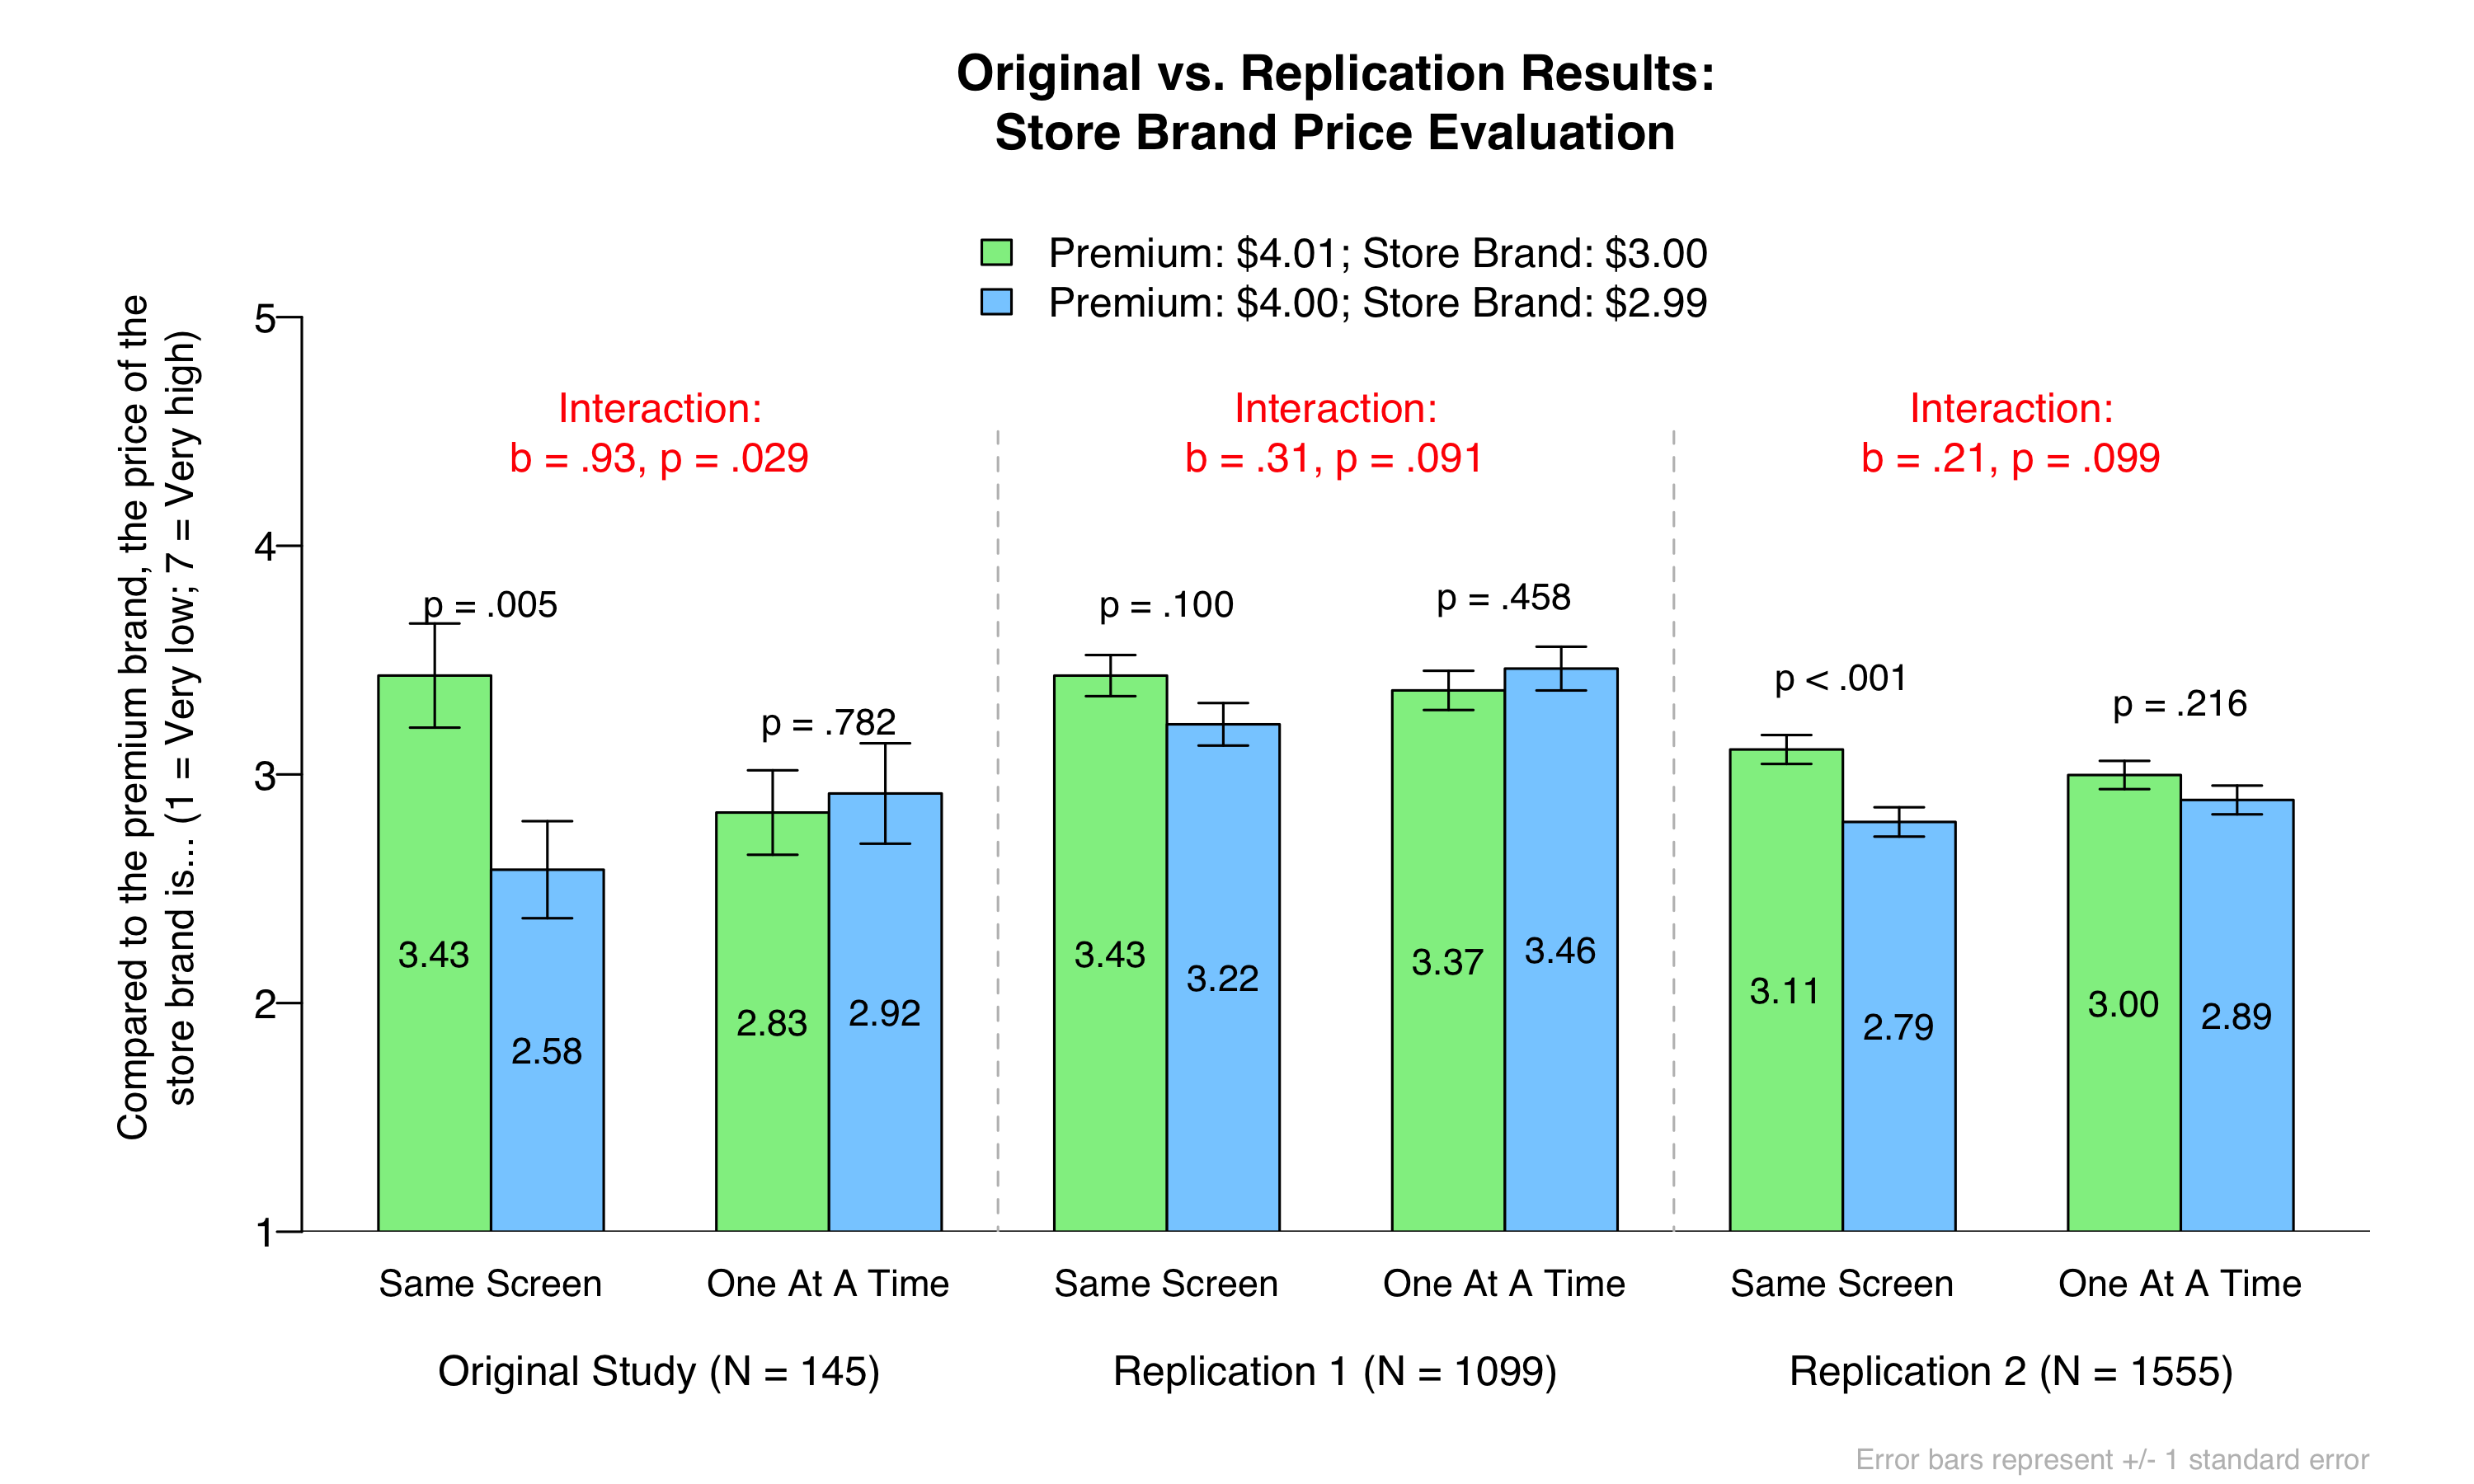
Here are the original vs. replication results. Note that there is a left-digit bias whenever a green bar is higher than the adjacent blue bar:

Here are the big takeaways.
First, you can see that we find marginally significant support for the authors’ key interaction in both replications. The left-digit bias is directionally larger when the prices are presented on the same screen than when the prices are presented in different screens. Although the evidence is much weaker than in the original study, we are inclined to believe that the original effect is real.
Second, if we didn’t observe a significant interaction with 1,100-1,600 participants, it is unlikely that you can reliably detect this interaction in a study that contains 145 participants. Indeed, our analyses show that the original study had only 9.3% power to detect the Replication 1 result and 7.8% power to detect the Replication 2 result. You’d need 3,000 participants (750 per cell) to have an 80% chance of detecting the Replication 1 result, and 4,500 participants to have an 80% chance of detecting the Replication 2 result [7].
Third, using CloudResearch Approved Participants (in Replication 2) seemed to strengthen the left-digit bias in the Same Screen condition, perhaps because these participants are more attentive (for evidence see this footnote: [8]). But it did not increase the size of the authors’ interaction effect. Because of this, we think it is unlikely that our smaller effect size is driven by our somehow recruiting lower quality MTurkers.
Conclusion
In sum, we think the totality of the evidence suggests that the left-digit bias is larger when the products/prices are presented on the same screen than when they are presented sequentially. At the same time, our evidence suggests that the effect is much smaller than the original authors reported, and that thousands of participants may be required to reliably produce it.

Author Feedback
When we reached out to the authors for comment, they had this to say:
"We are very happy to learn that you replicated our results. We are not surprised that the general pattern reported in the paper replicates: prior to and during the review process we internally replicated all of the reported studies. In addition, following your earlier email, we successfully replicated study 1 in August 2020. In that study (N = 404), we observed a significant left-digit bias in the "Side-By-Side" condition (M3.00 = 3.38 vs. M2.99 = 2.85; b=-.53, SE=.19, t=-2.79, p=.006) and no left-digit bias in the "One At A Time" condition (M3.00=3.18 vs. M2.99=3.18; b=.00, SE=.20, t=0.02, p=.981). The critical interaction test produced b=.53, SE=.27, t=1.96, p=.051. Our data set is posted on the Open Science Framework."
Footnotes.
- In our Data Colada Seminar Series, Devin Pope recently presented very compelling evidence for the left digit bias among Lyft riders. You can watch that talk here: https://www.youtube.com/watch?v=9uUPd313vYk. [↩]
- Study 3 had a larger effect but was much more complicated. [↩]
- Specifically, in the first replication, we used MTurkers with at least a 98% approval rating and at least 1,000 HITs completed. In the second replication, we used only “CloudResearch Approved Participants” with at least a 98% approval rating and at least 1,000 HITs completed. [↩]
- For quality control, we pre-registered to exclude all observations associated with duplicate MTurk IDs or IP Addresses, and to exclude those whose actual MTurk IDs were different than their reported IDs. [↩]
- We decided to increase the sample size in Replication 2 after observing marginally significant results in Replication 1. We went so big on both sample sizes because we know from experience (and math) that you often need very large samples to detect attenuated interactions (see Data Colada[17]. [↩]
- Actually, in the “One At A Time” condition, the products and measures were presented across five screens rather than three. The first screen showed the premium brand and its price. The second screen displayed an asterisk for one second. The third screen showed the store brand and its price. The fourth screen displayed another asterisk for one second. And then the fifth screen presented the dependent measure. According to the authors, “The asterisk was used to clear participants’ visuospatial sketchpads and make it more difficult for them to retain precise perceptual representations in memory (Baddeley and Hitch 1974).” [↩]
- You really should let all of this sink in. First, to study things like this you need really gigantic samples. Second, the difference in your required sample size between a true b = .31 (Replication 1) and a true b = .21 (Replication 2) is 1,500 participants! In our field, we tend to be entirely indifferent to an effect size difference of that magnitude. But that seemingly meaningless difference can dramatically affect how expensive (or possible) it is to study something. [↩]
- We added an attention check to the very end of the survey. Specifically, we asked participants, “Which product category were you NOT asked about in this survey?” The response options included the five categories that were presented plus one – Jam – that wasn’t. Echoing our findings from Data Replicada #7, we found that the CloudResearch Approved Participants (87.1%) were more likely to pass the attention check than were those in Replication 1 (78.5%). It is often dangerous to remove participants based on an attention check that comes after the key manipulations and measures, but in case you are curious: Removing participants who failed the check made the results of Replication 1 slightly weaker (b = .25, p = .198) and the results of Replication 2 slightly stronger (b = .28, p = .038). [↩]
