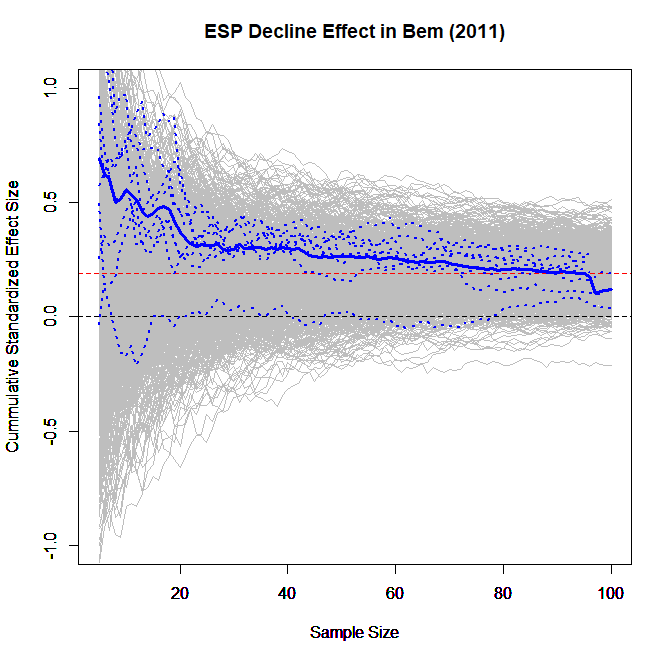
Uli Schimmack recently identified an interesting pattern in the data from Daryl Bem’s infamous “Feeling the Future” JPSP paper, in which he reported evidence for the existence of extrasensory perception (ESP; htm)[1]. In each study, the effect size is larger among participants who completed the study earlier (blogpost: .htm). Uli referred to this as the "decline effect." Here is his key chart:
The y-axis represents the cumulative effect size, and the x-axis the order in which subjects participated.
The nine dashed blue lines represent each of Bem's nine studies. The solid blue line represents the average effect across the nine studies. For the purposes of this post you can ignore the gray areas of the chart [2].
Uli’s analysis is ingenious, stimulating, and insightful, and the pattern he discovered is puzzling and interesting. We've enjoyed thinking about it. And in doing so, we have come to believe that Uli’s explanation for this pattern is ultimately incorrect, for reasons that are quite counter-intuitive (at least to us). [3].
Pilot dropping
Uli speculated that Bem did something that we will refer to as pilot dropping. In Uli’s words: “we are seeing a subset of attempts that showed promising results after peeking at the data. Unlike optional stopping, however, a researcher continues to collect more data to see whether the effect is real (…) the strong effect during the initial trials (…) is sufficient to maintain statistical significance (…) as more participants are added” (.htm).
In our “False-Positively Psychology” paper (.pdf) we barely mentioned pilot-dropping as a form of p-hacking (p. 1361) and so we were intrigued about the possibility that it explains Bem’s impossible results.
Pilot dropping can make false-positives harder to get
It is easiest to quantify the impact of pilot dropping on false-positives by computing how many participants you need to run before a successful (false-positive) result is expected.
Let’s say you want to publish a study with two between-subjects condition and n=100 per condition (N=200 total). If you don't p-hack at all, then on average you need to run 20 studies to obtain one false-positive finding [4]. With N=200 in each study, then that means you need an average of 4,000 participants to obtain one finding.
The effects of pilot-dropping are less straightforward to compute, and so we simulated it [5].
We considered a researcher who collects a “pilot” of, say, n = 25. (We show later the size of the pilot doesn’t matter much). If she gets a high p-value the pilot is dropped. If she gets a low p-value she keeps the pilot and adds the remaining subjects to get to 100 (so she runs another n=75 in this case).
How many subjects she ends up running depends on what threshold she selects for dropping the pilot. Two things are counter-intuitive.
First, the lower the threshold to continue with the study (e.g., p<.05 instead of p<.10), the more subjects she ends up running in total.
Second, she can easily end up running way more subjects than if she didn’t pilot-drop or p-hack at all.
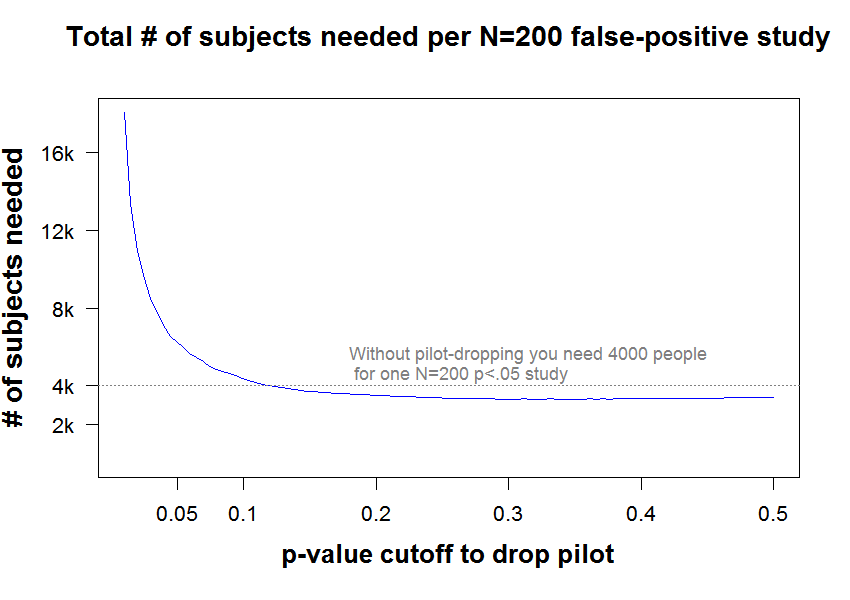
This chart has the results (R Code):

Note that if pilots are dropped when they obtain p>.05, it takes about 50% more participants on average to get a single study to work (because you drop too many pilots, and still many full studies don’t work).
Moreover, Uli conjectured that Bem added observations only when obtaining a “strong effect”. If we operationalize strong effect as p<.01, we now need about N=18,000 for one study to work, instead of “only” 4,000.
With higher thresholds, pilot-dropping does help, but only a little (the blue line is never too far below 4,000). For example, dropping pilots using a threshold of p>.30 is near the 'optimum,' and the expected number of subjects is about 3400.
As mentioned, these results do not hinge on the size of the pilot, i.e., on the assumed n=25 (see charts .pdf).
What’s the intuition?
Pilot dropping has two effects.
(1) It saves subjects by cutting losses after a bad early draw.
(2) It costs subjects by interrupting a study that would have worked had it gone all the way.
For lower cutoffs, (2) is larger than (1)
What does explain the decline effect in this dataset?
We were primarily interested in the consequences of pilot dropping, but the discovery that pilot dropping is not very consequential does not bring us closer to understanding the patterns that Uli found in Bem’s data. One possibility is pilot-hacking, superficially similar to, but critically different from, pilot-dropping.
It would work like this: you run a pilot and you intensely p-hack it, possibly well past p=.05. Then you keep collecting more data and analyze them the same (or a very similar) way. That probably feels honest (regardless, it’s wrong). Unlike pilot dropping, pilot hacking would dramatically decrease the # of subjects needed for a false-positive finding, because way fewer pilots would be dropped thanks to p-hacking, and because you would start with a much stronger effect so more studies would end up surviving the added observations (e.g., instead of needing 20 attempts to get a pilot to get p<.05, with p-hacking one often needs only 1). Of course, just because pilot-hacking would produce a pattern like that identified by Uli, one should not conclude that's what happened.
Alternative explanations for decline effects within study
1) Researchers may make a mistake when sorting the data (e.g., sorting by the dependent variable and not including the timestamp in their sort, thus creating a spurious association between time and effect) [6].
2) People who participate earlier in a study could plausibly show a larger effect than those that participate later; for example, if responsible students participate earlier and pay more attention to instructions (this is not a particularly plausible explanation for Bem, as precognition is almost certainly zero for everyone) [7]
3) Researchers may put together a series of small experiments that were originally run separately and present them as "one study," and (perhaps inadvertently) put within the compiled dataset studies that obtained larger effects first.
Summary
Pilot dropping is not a plausible explanation for Bem’s results in general nor for the pattern of decreasing effect size in particular. Moreover, because it backfires, it is not a particularly worrisome form of p-hacking.
![]()
Author feedback.
Our policy (.htm) is to share, prior to publication, drafts of posts with original authors whose work we discuss, asking them to identify anything that is unfair, inaccurate, misleading, snarky, or poorly worded. We shared a draft with Daryl Bem and Uli Schimmack. Uli replied and suggested that we extend the analyses to smaller sample sizes for the full study. We did. The qualitative conclusion was the same. The posted R Code includes the more flexible simulations that accommodated his suggestion. We are grateful for Uli's feedback.
- In this paper, Bem claimed that participants were affected by treatments that they received in the future. Since causation doesn't work that way, and since some have failed to replicate Bem's results, many scholars do not believe Bem's conclusion [↩]
- The gray lines are simulated data when the true effect is d=.2 [↩]
- To give a sense of how much we lacked the intuition, at least one of us was pretty convinced by Uli’s explanation. We conducted the simulations below not to make a predetermined point, but because we really did not know what to expect. [↩]
- The median number of studies needed is about 14; there is a long tail [↩]
- The key number one needs is the probability that the full study will work, conditional on having decided to run it after seeing the pilot. That’s almost certainly possible to compute with formulas, but why bother? [↩]
- This does not require a true effect, as the overall effect behind the spurious association could have been p-hacked [↩]
- Ebersole et al., in "Many Labs 3" (.htm), find no evidence of a decline over the semester; but that's a slightly different hypothesis. [↩]
